|
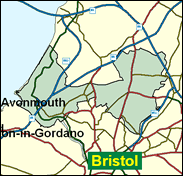
Bristol North West
Labour hold

Labour's chances of holding North West will in the long run be improved by further favourable boundary changes, if the provisional recommendations of the Commission which began its work in 2000 are accepted. However, the next contest may be closer, although it is hard to see Labour losing all the 20 per cent lead the built up in their landslide year of 1997. The time is approaching when Bristol NW cannot be considered to be a marginal any more. Labour retained a lead even in the Euro-elections of 1999, which is a good sign since the did very badly in these nationally and "lost" almost all their marginals (in fact the elections were conducted under regional PR and the constituency results are only added up for information).

Doug Naysmith finally won here in 1997 - a seasoned campaigner from earlier election campaigns, and one of them in this seat in 1992. A grey-bearded immunologist at Bristol University, with a doctorate from Edinburgh University, he was born in 1941 and educated at George Heriot School, Edinburgh, and at Edinburgh and Yale Universities. Arriving late (aged 56) after 17 years on Bristol City Council, with no prospect of advancement, he has been an unobtrusive backbencher, his Leftist (CND) past airbrushed by the culture of loyalism pervading the post-1997 PLP.

 |
| Wealthy Achievers, Suburban Areas |
3.06% |
14.99% |
20.44 |
|
| Affluent Greys, Rural Communities |
0.00% |
2.13% |
0.00 |
|
| Prosperous Pensioners, Retirement Areas |
0.35% |
2.49% |
13.89 |
|
| Affluent Executives, Family Areas |
12.31% |
4.43% |
278.15 |
|
| Well-Off Workers, Family Areas |
5.51% |
7.27% |
75.80 |
|
| Affluent Urbanites, Town & City Areas |
1.33% |
2.56% |
51.92 |
|
| Prosperous Professionals, Metropolitan Areas |
0.00% |
2.04% |
0.00 |
|
| Better-Off Executives, Inner City Areas |
0.50% |
3.94% |
12.72 |
|
| Comfortable Middle Agers, Mature Home Owning Areas |
12.10% |
13.04% |
92.81 |
|
| Skilled Workers, Home Owning Areas |
17.94% |
12.70% |
141.19 |
|
| New Home Owners, Mature Communities |
17.75% |
8.14% |
218.00 |
|
| White Collar Workers, Better-Off Multi Ethnic Areas |
0.76% |
4.02% |
18.93 |
|
| Older People, Less Prosperous Areas |
8.75% |
3.19% |
274.73 |
|
| Council Estate Residents, Better-Off Homes |
13.56% |
11.31% |
119.89 |
|
| Council Estate Residents, High Unemployment |
2.18% |
3.06% |
71.33 |
|
| Council Estate Residents, Greatest Hardship |
3.89% |
2.52% |
154.43 |
|
| People in Multi-Ethnic, Low-Income Areas |
0.00% |
2.10% |
0.00 |
|
| Unclassified |
0.00% |
0.06% |
0.00 |
|
|
 |
 |
 |
| £0-5K |
10.28% |
9.41% |
109.24 |
|
| £5-10K |
18.41% |
16.63% |
110.71 |
|
| £10-15K |
18.05% |
16.58% |
108.88 |
|
| £15-20K |
14.39% |
13.58% |
105.92 |
|
| £20-25K |
10.64% |
10.39% |
102.40 |
|
| £25-30K |
7.66% |
7.77% |
98.54 |
|
| £30-35K |
5.47% |
5.79% |
94.49 |
|
| £35-40K |
3.91% |
4.33% |
90.36 |
|
| £40-45K |
2.82% |
3.27% |
86.25 |
|
| £45-50K |
2.04% |
2.48% |
82.22 |
|
| £50-55K |
1.49% |
1.90% |
78.34 |
|
| £55-60K |
1.10% |
1.47% |
74.63 |
|
| £60-65K |
0.82% |
1.15% |
71.10 |
|
| £65-70K |
0.61% |
0.91% |
67.78 |
|
| £70-75K |
0.47% |
0.72% |
64.66 |
|
| £75-80K |
0.35% |
0.57% |
61.74 |
|
| £80-85K |
0.27% |
0.46% |
59.00 |
|
| £85-90K |
0.21% |
0.37% |
56.45 |
|
| £90-95K |
0.16% |
0.31% |
54.06 |
|
| £95-100K |
0.13% |
0.25% |
51.84 |
|
| £100K + |
0.55% |
1.34% |
40.98 |
|
|
|

|


|
1992-1997
|
1997-2001
|
|
|
|
| Con |
-9.49% |
| Lab |
4.71% |
| LD |
-1.65% |
|
| Con |
0.24% |
| Lab |
4.18% |
| LD |
3.21% |
|
|
 |
Douglas Naysmith
Labour hold
|
| Con |
 |
13,349 |
29.55% |
| Lab |
 |
24,436 |
54.10% |
| LD |
 |
7,387 |
16.35% |
| Oth |
|
0 |
0.00% |
| Maj |
 |
11,087 |
24.54% |
| Turn |
 |
45,172 |
58.85% |
|
|
 |
Douglas Naysmith
Labour hold
|
| C |
Charles Hansard |
13,349 |
29.55% |
| LC |
Douglas Naysmith |
24,436 |
54.10% |
| LD |
Peter Tyzack |
7,387 |
16.35% |
|
Candidates representing 3 parties stood for election to this seat.
|
|
 |
Douglas Naysmith
Labour
|
| Con |
 |
16,193 |
29.31% |
| Lab |
 |
27,575 |
49.91% |
| LD |
 |
7,263 |
13.15% |
| Ref |
 |
1,609 |
2.91% |
| Oth |
 |
2,605 |
4.72% |
| Maj |
 |
11,382 |
20.60% |
| Turn |
 |
55,245 |
73.65% |
|
|
 |
|
Labour
|
| Con |
 |
23,148 |
38.80% |
| Lab |
 |
27,019 |
45.20% |
| LD |
 |
8,849 |
14.80% |
| Oth |
 |
703 |
1.20% |
| Maj |
 |
3,871 |
6.50% |
| Turn |
 |
59,719 |
81.20% |
|
|
 |
|

|

