|
Bristol West
Labour hold

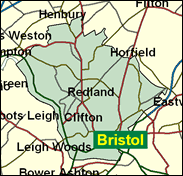
Surely one of the most interesting contests in the country may be expected next time in the very large seat of Bristol West: in 1997, with 84,870 voters, it was the second largest parliamentary constituency after the anomalous Isle of Wight. All three main parties polled over 17,500 voters, and Labour's Valerie Davey took her party from third place to a narrow victory over Cabinet Minister William Waldegrave. In due course the seat, which must lose electors in the next boundary changes, may become more inclined to Labour as the ultra-Tory Stoke Bishop joins the similar Westbury on Trym in the North West division of the city, but the immediate contest will be fought on the same lines as last time. It is never predictable, but the Conservatives will count themselves favourites; it is very well worth staying up to keep an eye on West as the next General Election night progresses.

Valerie Davey, surprise Labour victor here in 1997 on the back of a helpful Observer opinion poll, has been an unobtrusive backbencher posing 7 written questions in her first year. A standard issue Labour MP as a former teacher turned full-time councillor, she was born 1940, educated at undisclosed schools and at Birmingham University. Of mousey-looking blue-stocking appearance and of Methodist affiliation, she is challenged by Pamela Chesters for the Conservatives. Scots-born in 1956, educated at George Watson's Ladies College, Edinburgh, and St Andrew's University, she is now London-based as leader of the Tory group on Camden Council, where she claims to have split the ruling Labour Group. A former BP executive she now runs with her husband a management consultancy serving blue chip companies.

 |
| Wealthy Achievers, Suburban Areas |
18.54% |
14.99% |
123.63 |
|
| Affluent Greys, Rural Communities |
0.00% |
2.13% |
0.00 |
|
| Prosperous Pensioners, Retirement Areas |
1.52% |
2.49% |
61.22 |
|
| Affluent Executives, Family Areas |
0.26% |
4.43% |
5.81 |
|
| Well-Off Workers, Family Areas |
0.00% |
7.27% |
0.06 |
|
| Affluent Urbanites, Town & City Areas |
21.94% |
2.56% |
855.47 |
|
| Prosperous Professionals, Metropolitan Areas |
3.90% |
2.04% |
191.21 |
|
| Better-Off Executives, Inner City Areas |
36.24% |
3.94% |
919.02 |
|
| Comfortable Middle Agers, Mature Home Owning Areas |
2.58% |
13.04% |
19.75 |
|
| Skilled Workers, Home Owning Areas |
1.69% |
12.70% |
13.33 |
|
| New Home Owners, Mature Communities |
1.88% |
8.14% |
23.03 |
|
| White Collar Workers, Better-Off Multi Ethnic Areas |
7.66% |
4.02% |
190.36 |
|
| Older People, Less Prosperous Areas |
0.29% |
3.19% |
9.08 |
|
| Council Estate Residents, Better-Off Homes |
0.00% |
11.31% |
0.00 |
|
| Council Estate Residents, High Unemployment |
0.91% |
3.06% |
29.84 |
|
| Council Estate Residents, Greatest Hardship |
0.00% |
2.52% |
0.00 |
|
| People in Multi-Ethnic, Low-Income Areas |
2.57% |
2.10% |
122.52 |
|
| Unclassified |
0.02% |
0.06% |
30.03 |
|
|
 |
 |
 |
| £0-5K |
6.89% |
9.41% |
73.17 |
|
| £5-10K |
11.92% |
16.63% |
71.65 |
|
| £10-15K |
13.03% |
16.58% |
78.60 |
|
| £15-20K |
11.94% |
13.58% |
87.89 |
|
| £20-25K |
10.18% |
10.39% |
97.92 |
|
| £25-30K |
8.40% |
7.77% |
108.03 |
|
| £30-35K |
6.83% |
5.79% |
117.92 |
|
| £35-40K |
5.52% |
4.33% |
127.43 |
|
| £40-45K |
4.46% |
3.27% |
136.50 |
|
| £45-50K |
3.60% |
2.48% |
145.11 |
|
| £50-55K |
2.92% |
1.90% |
153.26 |
|
| £55-60K |
2.37% |
1.47% |
160.98 |
|
| £60-65K |
1.94% |
1.15% |
168.29 |
|
| £65-70K |
1.59% |
0.91% |
175.21 |
|
| £70-75K |
1.31% |
0.72% |
181.79 |
|
| £75-80K |
1.08% |
0.57% |
188.05 |
|
| £80-85K |
0.90% |
0.46% |
194.01 |
|
| £85-90K |
0.75% |
0.37% |
199.69 |
|
| £90-95K |
0.63% |
0.31% |
205.13 |
|
| £95-100K |
0.53% |
0.25% |
210.35 |
|
| £100K + |
3.24% |
1.34% |
240.98 |
|
|
|

|


|
1992-1997
|
1997-2001
|
|
|
|
| Con |
-12.25% |
| Lab |
11.83% |
| LD |
-1.18% |
|
| Con |
6.32% |
| Lab |
14.84% |
| LD |
-23.23% |
|
|
 |
Valerie Davey
Labour hold
|
| Con |
 |
16,040 |
39.16% |
| Lab |
 |
20,505 |
50.06% |
| LD |
 |
1,961 |
4.79% |
| Oth |
 |
2,451 |
5.98% |
| Maj |
 |
4,465 |
10.90% |
| Turn |
 |
40,957 |
48.29% |
|
|
 |
Valerie Davey
Labour hold
|
| C |
Pamela Chesters |
16,040 |
39.16% |
| L |
Valerie Davey |
20,505 |
50.06% |
| G |
John Devaney |
1,961 |
4.79% |
| UK |
Simon Muir |
490 |
1.20% |
| LD |
Stephen Williams |
1,961 |
4.79% |
|
Candidates representing 5 parties stood for election to this seat.
|
|
 |
Valerie Davey
Labour gain
|
| Con |
 |
20,575 |
32.85% |
| Lab |
 |
22,068 |
35.23% |
| LD |
 |
17,551 |
28.02% |
| Ref |
 |
1,304 |
2.08% |
| Oth |
 |
1,143 |
1.82% |
| Maj |
 |
1,493 |
2.38% |
| Turn |
 |
62,641 |
73.81% |
|
|
 |
|
Conservative
|
| Con |
 |
26,850 |
45.10% |
| Lab |
 |
13,900 |
23.40% |
| LD |
 |
17,356 |
29.20% |
| Oth |
 |
1,371 |
2.30% |
| Maj |
 |
9,494 |
16.00% |
| Turn |
 |
59,477 |
76.34% |
|
|
 |
|

|

