|
Cambridgeshire North West
Conservative hold

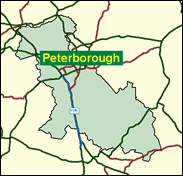
A new seat in 1997, this provided a refuge for the Chairman of the Conservative Party, Brian Mawhinney, as it took in four wards of his former Peterborough seat south of the River Nene, as well as about half of John Major's oversized Huntingdon. Mawhinney was lucky in a way, for Peterborough itself fell to Labour and Cambridgeshire North West remained safely Conservative, but he scarcely had a party left to chair, as his neighbour led it to the worst defeat for a hundred years. He should be able to remain MP here as long as he wants, but surely the chance of recovering office is very slim.

A rare Ulsterman in mainland politics, Sir Brian Mawhinney, who moved from Peterborough to this safer seat, comes with an oddly mirthless smile and a reputation as something of a martinet. A hapless Tory Party chairman under Major, he at least got into a lifeboat as the rest went down with the sliding deckchairs in May 1997 - the worst Tory sinking in 150 years - and has oddly lingered since. Entering the Commons in 1979, he rose through posts in Ulster, Health and Transport. Born 1940, he attended Royal Belfast Academical Institution and Queen's University Belfast, Michigan University and London University (where he obtained a doctorate in radiation biology). An Anglican, but with Plymouth Brethren origins, his civil servants reputedly greeted his arrival with "the Ego has landed."

 |
| Wealthy Achievers, Suburban Areas |
25.34% |
14.99% |
168.98 |
|
| Affluent Greys, Rural Communities |
1.05% |
2.13% |
49.53 |
|
| Prosperous Pensioners, Retirement Areas |
2.48% |
2.49% |
99.83 |
|
| Affluent Executives, Family Areas |
15.47% |
4.43% |
349.70 |
|
| Well-Off Workers, Family Areas |
13.40% |
7.27% |
184.28 |
|
| Affluent Urbanites, Town & City Areas |
0.57% |
2.56% |
22.11 |
|
| Prosperous Professionals, Metropolitan Areas |
0.00% |
2.04% |
0.00 |
|
| Better-Off Executives, Inner City Areas |
0.08% |
3.94% |
2.15 |
|
| Comfortable Middle Agers, Mature Home Owning Areas |
12.04% |
13.04% |
92.36 |
|
| Skilled Workers, Home Owning Areas |
9.95% |
12.70% |
78.32 |
|
| New Home Owners, Mature Communities |
5.61% |
8.14% |
68.84 |
|
| White Collar Workers, Better-Off Multi Ethnic Areas |
0.48% |
4.02% |
11.94 |
|
| Older People, Less Prosperous Areas |
2.94% |
3.19% |
92.22 |
|
| Council Estate Residents, Better-Off Homes |
9.97% |
11.31% |
88.14 |
|
| Council Estate Residents, High Unemployment |
0.13% |
3.06% |
4.19 |
|
| Council Estate Residents, Greatest Hardship |
0.44% |
2.52% |
17.62 |
|
| People in Multi-Ethnic, Low-Income Areas |
0.00% |
2.10% |
0.00 |
|
| Unclassified |
0.04% |
0.06% |
68.02 |
|
|
 |
 |
 |
| £0-5K |
7.44% |
9.41% |
79.09 |
|
| £5-10K |
14.69% |
16.63% |
88.33 |
|
| £10-15K |
16.03% |
16.58% |
96.70 |
|
| £15-20K |
13.96% |
13.58% |
102.78 |
|
| £20-25K |
11.10% |
10.39% |
106.80 |
|
| £25-30K |
8.50% |
7.77% |
109.29 |
|
| £30-35K |
6.41% |
5.79% |
110.67 |
|
| £35-40K |
4.82% |
4.33% |
111.29 |
|
| £40-45K |
3.64% |
3.27% |
111.38 |
|
| £45-50K |
2.76% |
2.48% |
111.10 |
|
| £50-55K |
2.11% |
1.90% |
110.57 |
|
| £55-60K |
1.62% |
1.47% |
109.87 |
|
| £60-65K |
1.26% |
1.15% |
109.07 |
|
| £65-70K |
0.98% |
0.91% |
108.21 |
|
| £70-75K |
0.77% |
0.72% |
107.30 |
|
| £75-80K |
0.61% |
0.57% |
106.38 |
|
| £80-85K |
0.49% |
0.46% |
105.46 |
|
| £85-90K |
0.39% |
0.37% |
104.55 |
|
| £90-95K |
0.32% |
0.31% |
103.65 |
|
| £95-100K |
0.26% |
0.25% |
102.76 |
|
| £100K + |
1.31% |
1.34% |
97.45 |
|
|
|

|


|
1992-1997
|
1997-2001
|
|
|
|
| Con |
-14.29% |
| Lab |
6.33% |
| LD |
6.43% |
|
| Con |
1.70% |
| Lab |
-0.85% |
| LD |
0.69% |
|
|
 |
Brian Mawhinney
Conservative hold
|
| Con |
 |
21,895 |
49.81% |
| Lab |
 |
13,794 |
31.38% |
| LD |
 |
6,957 |
15.83% |
| Oth |
 |
1,310 |
2.98% |
| Maj |
 |
8,101 |
18.43% |
| Turn |
 |
43,956 |
62.29% |
|
|
 |
Brian Mawhinney
Conservative hold
|
| L |
Anthea Cox |
13,794 |
31.38% |
| I |
David Hall |
429 |
0.98% |
| UK |
Barry Hudson |
881 |
2.00% |
| C |
Brian Mawhinney |
21,895 |
49.81% |
| LD |
Alastair Taylor |
6,957 |
15.83% |
|
Candidates representing 5 parties stood for election to this seat.
|
|
 |
Brian Mawhinney
Conservative
|
| Con |
 |
23,488 |
48.11% |
| Lab |
 |
15,734 |
32.23% |
| LD |
 |
7,388 |
15.13% |
| Ref |
 |
1,939 |
3.97% |
| Oth |
 |
269 |
0.55% |
| Maj |
 |
7,754 |
15.88% |
| Turn |
 |
48,818 |
74.20% |
|
|
 |
|
Conservative
|
| Con |
 |
32,170 |
62.40% |
| Lab |
 |
13,361 |
25.90% |
| LD |
 |
4,503 |
8.70% |
| Oth |
 |
1,559 |
3.00% |
| Maj |
 |
18,809 |
36.50% |
| Turn |
 |
51,593 |
78.60% |
|
|
 |
|

|

