|
Cunninghame South
Labour hold

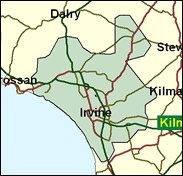
South is safer than its northern counterpart, and there is little pretty here. The seat is based on the New Town of Irvine, which never grew to its allotted targets, and some working class territory inland in the Garnock valley. Brian Donohoe won by 42pc from the SNP in 1997 and in the 1999 Holyrood parliament contest Labour's candidate, whose name was Oldfather, won easily from the Nationalist challenger who was Russell and the Conservative who was Tosh.

Labour MP Brian Donohoe’s fame-for-15-minutes came in May 1997 when Tony Blair phoned to offer him a job as junior agriculture minister before he realised he wasn’t talking to Lord (Bernard) Donaghue. A former draughtsman and NALGO official, first elected here in 1992, he was born in 1948, educated at Irvine Royal Academy and Kilmarnock Technical College. He has called for Scottish railways to be under the Scottish Parliament and for rail part-renationalisation.
 |
| Wealthy Achievers, Suburban Areas |
2.56% |
14.99% |
17.07 |
|
| Affluent Greys, Rural Communities |
0.37% |
2.13% |
17.59 |
|
| Prosperous Pensioners, Retirement Areas |
0.02% |
2.49% |
0.72 |
|
| Affluent Executives, Family Areas |
8.22% |
4.43% |
185.70 |
|
| Well-Off Workers, Family Areas |
8.35% |
7.27% |
114.73 |
|
| Affluent Urbanites, Town & City Areas |
0.90% |
2.56% |
35.19 |
|
| Prosperous Professionals, Metropolitan Areas |
0.00% |
2.04% |
0.00 |
|
| Better-Off Executives, Inner City Areas |
0.27% |
3.94% |
6.85 |
|
| Comfortable Middle Agers, Mature Home Owning Areas |
0.94% |
13.04% |
7.20 |
|
| Skilled Workers, Home Owning Areas |
6.19% |
12.70% |
48.71 |
|
| New Home Owners, Mature Communities |
5.39% |
8.14% |
66.22 |
|
| White Collar Workers, Better-Off Multi Ethnic Areas |
0.98% |
4.02% |
24.27 |
|
| Older People, Less Prosperous Areas |
7.62% |
3.19% |
239.16 |
|
| Council Estate Residents, Better-Off Homes |
42.37% |
11.31% |
374.62 |
|
| Council Estate Residents, High Unemployment |
6.48% |
3.06% |
211.47 |
|
| Council Estate Residents, Greatest Hardship |
9.35% |
2.52% |
371.36 |
|
| People in Multi-Ethnic, Low-Income Areas |
0.00% |
2.10% |
0.00 |
|
| Unclassified |
0.00% |
0.06% |
0.00 |
|
|
 |
 |
 |
| £0-5K |
11.49% |
9.41% |
122.05 |
|
| £5-10K |
19.56% |
16.63% |
117.60 |
|
| £10-15K |
18.43% |
16.58% |
111.14 |
|
| £15-20K |
14.19% |
13.58% |
104.43 |
|
| £20-25K |
10.20% |
10.39% |
98.15 |
|
| £25-30K |
7.19% |
7.77% |
92.47 |
|
| £30-35K |
5.06% |
5.79% |
87.40 |
|
| £35-40K |
3.59% |
4.33% |
82.87 |
|
| £40-45K |
2.57% |
3.27% |
78.80 |
|
| £45-50K |
1.86% |
2.48% |
75.13 |
|
| £50-55K |
1.37% |
1.90% |
71.79 |
|
| £55-60K |
1.01% |
1.47% |
68.75 |
|
| £60-65K |
0.76% |
1.15% |
65.96 |
|
| £65-70K |
0.57% |
0.91% |
63.39 |
|
| £70-75K |
0.44% |
0.72% |
61.02 |
|
| £75-80K |
0.34% |
0.57% |
58.81 |
|
| £80-85K |
0.26% |
0.46% |
56.76 |
|
| £85-90K |
0.21% |
0.37% |
54.85 |
|
| £90-95K |
0.16% |
0.31% |
53.05 |
|
| £95-100K |
0.13% |
0.25% |
51.37 |
|
| £100K + |
0.57% |
1.34% |
42.77 |
|
|
|

|


|
1992-1997
|
1997-2001
|
|
|
|
| Con |
-6.22% |
| Lab |
9.83% |
| LD |
-1.67% |
| SNP |
-3.42% |
|
| Con |
-0.50% |
| Lab |
-4.09% |
| LD |
2.95% |
| SNP |
-2.23% |
|
|
 |
Brian Donohoe
Labour hold
|
| Con |
 |
2,682 |
9.58% |
| Lab |
 |
16,424 |
58.64% |
| LD |
 |
2,094 |
7.48% |
| SNP |
 |
5,194 |
18.54% |
| Oth |
 |
1,615 |
5.77% |
| Maj |
 |
11,230 |
40.09% |
| Turn |
 |
28,009 |
56.04% |
|
|
 |
Brian Donohoe
Labour hold
|
| LD |
John Boyd |
2,094 |
7.48% |
| SSP |
Rosemary Byrne |
1,233 |
4.40% |
| SL |
Bobby Cochrane |
382 |
1.36% |
| L |
Brian Donohoe |
16,424 |
58.64% |
| SNP |
Bill Kidd |
5,194 |
18.54% |
| C |
Pam Paterson |
2,682 |
9.58% |
|
Candidates representing 6 parties stood for election to this seat.
|
|
 |
Brian Donohoe
Labour
|
| Con |
 |
3,571 |
10.08% |
| Lab |
 |
22,233 |
62.73% |
| LD |
 |
1,604 |
4.53% |
| SNP |
 |
7,364 |
20.78% |
| Ref |
 |
178 |
0.50% |
| Oth |
 |
494 |
1.39% |
| Maj |
 |
14,869 |
41.95% |
| Turn |
 |
35,444 |
71.54% |
|
|
 |
|
Labour
|
| Con |
 |
6,070 |
16.30% |
| Lab |
 |
19,687 |
52.90% |
| LD |
 |
2,299 |
6.20% |
| SNP |
 |
9,007 |
24.20% |
| Oth |
 |
128 |
0.30% |
| Maj |
 |
10,680 |
28.70% |
| Turn |
 |
37,191 |
74.76% |
|
|
 |
|

|

