|
Dunfermline West
Labour hold

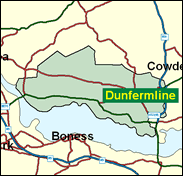
For 500 years Dunfermline was Scotland's capital, and in its abbey is buried a national hero, Robert Bruce, among eight kings, five queens, six princes and two princesses of the Scottish royal house. It is also the birthplace of the philanthropist Andrew Carnegie. Dunfermline itself is entirely within the West constituency, and as its distinguished history implies it is more mixed in its development and its politics than the heavy industry of Gordon Brown's Dunfermline East. It is still safely Labour, though, with the opposition to Rachel Squire so evenly split that even her 53pc share, modest by Labour's standards in its Scottish seats, was 34pc ahead of the SNP in second place. The Liberal Democrats pip the Conservatives for the bronze medal position. This order was maintained in the 1999 Scottish parliament elections.

Rachel Squire, PPS to Education and Employment ministers, was elected in 1992 for this seat. She gained selection, despite her English birth (born 1954, in Surrey) and private schooling (Godolphin & Latimer, Hammersmith, Durham and Birmingham Universities) through her trade union background as UNISON's Scottish Region Education Officer for 10 years. Inevitably she has become, despite her earlier opposition to the defence estimates, a campaigner for the threatened Rosyth Dockyard. With an angular countenance and deliberate mode of speech, and slowed down by a brain tumour in 1993, she must hope that her English origins will not threaten her survival in a Scotland increasingly driven by a nationalistic agenda.
 |
| Wealthy Achievers, Suburban Areas |
7.84% |
14.99% |
52.32 |
|
| Affluent Greys, Rural Communities |
0.01% |
2.13% |
0.70 |
|
| Prosperous Pensioners, Retirement Areas |
0.45% |
2.49% |
18.25 |
|
| Affluent Executives, Family Areas |
12.89% |
4.43% |
291.28 |
|
| Well-Off Workers, Family Areas |
13.57% |
7.27% |
186.52 |
|
| Affluent Urbanites, Town & City Areas |
4.58% |
2.56% |
178.73 |
|
| Prosperous Professionals, Metropolitan Areas |
0.91% |
2.04% |
44.46 |
|
| Better-Off Executives, Inner City Areas |
1.74% |
3.94% |
44.06 |
|
| Comfortable Middle Agers, Mature Home Owning Areas |
5.85% |
13.04% |
44.83 |
|
| Skilled Workers, Home Owning Areas |
7.45% |
12.70% |
58.64 |
|
| New Home Owners, Mature Communities |
7.51% |
8.14% |
92.28 |
|
| White Collar Workers, Better-Off Multi Ethnic Areas |
0.78% |
4.02% |
19.46 |
|
| Older People, Less Prosperous Areas |
6.82% |
3.19% |
214.13 |
|
| Council Estate Residents, Better-Off Homes |
19.27% |
11.31% |
170.33 |
|
| Council Estate Residents, High Unemployment |
6.20% |
3.06% |
202.45 |
|
| Council Estate Residents, Greatest Hardship |
4.12% |
2.52% |
163.74 |
|
| People in Multi-Ethnic, Low-Income Areas |
0.00% |
2.10% |
0.00 |
|
| Unclassified |
0.00% |
0.06% |
0.00 |
|
|
 |
 |
 |
| £0-5K |
9.89% |
9.41% |
105.02 |
|
| £5-10K |
17.71% |
16.63% |
106.48 |
|
| £10-15K |
17.37% |
16.58% |
104.75 |
|
| £15-20K |
13.97% |
13.58% |
102.84 |
|
| £20-25K |
10.48% |
10.39% |
100.88 |
|
| £25-30K |
7.68% |
7.77% |
98.81 |
|
| £30-35K |
5.60% |
5.79% |
96.63 |
|
| £35-40K |
4.09% |
4.33% |
94.37 |
|
| £40-45K |
3.01% |
3.27% |
92.05 |
|
| £45-50K |
2.23% |
2.48% |
89.73 |
|
| £50-55K |
1.66% |
1.90% |
87.41 |
|
| £55-60K |
1.26% |
1.47% |
85.13 |
|
| £60-65K |
0.95% |
1.15% |
82.89 |
|
| £65-70K |
0.73% |
0.91% |
80.71 |
|
| £70-75K |
0.57% |
0.72% |
78.61 |
|
| £75-80K |
0.44% |
0.57% |
76.57 |
|
| £80-85K |
0.35% |
0.46% |
74.61 |
|
| £85-90K |
0.27% |
0.37% |
72.73 |
|
| £90-95K |
0.22% |
0.31% |
70.92 |
|
| £95-100K |
0.17% |
0.25% |
69.19 |
|
| £100K + |
0.80% |
1.34% |
59.65 |
|
|
|

|


|
1992-1997
|
1997-2001
|
|
|
|
| Con |
-10.36% |
| Lab |
11.58% |
| LD |
-1.98% |
| SNP |
-0.63% |
|
| Con |
-2.42% |
| Lab |
-0.23% |
| LD |
1.98% |
| SNP |
-1.77% |
|
|
 |
Rachel Squire
Labour hold
|
| Con |
 |
3,166 |
10.22% |
| Lab |
 |
16,370 |
52.85% |
| LD |
 |
4,832 |
15.60% |
| SNP |
 |
5,390 |
17.40% |
| Oth |
 |
1,217 |
3.93% |
| Maj |
 |
10,980 |
35.45% |
| Turn |
 |
30,975 |
57.05% |
|
|
 |
Rachel Squire
Labour hold
|
| SNP |
Brian Goodall |
5,390 |
17.40% |
| UK |
Alastair Harper |
471 |
1.52% |
| C |
James Mackie |
3,166 |
10.22% |
| LD |
Russell McPhate |
4,832 |
15.60% |
| L |
Rachel Squire |
16,370 |
52.85% |
| SSP |
Kate Stewart |
746 |
2.41% |
|
Candidates representing 6 parties stood for election to this seat.
|
|
 |
Rachel Squire
Labour
|
| Con |
 |
4,606 |
12.64% |
| Lab |
 |
19,338 |
53.08% |
| LD |
 |
4,963 |
13.62% |
| SNP |
 |
6,984 |
19.17% |
| Ref |
 |
543 |
1.49% |
| Oth |
|
0 |
0.00% |
| Maj |
 |
12,354 |
33.91% |
| Turn |
 |
36,434 |
69.44% |
|
|
 |
|
Labour
|
| Con |
 |
8,948 |
23.00% |
| Lab |
 |
16,132 |
41.50% |
| LD |
 |
6,066 |
15.60% |
| SNP |
 |
7,703 |
19.80% |
| Oth |
|
0 |
0.00% |
| Maj |
 |
7,184 |
18.50% |
| Turn |
 |
38,849 |
75.90% |
|
|
 |
|

|

