|
Hackney North & Stoke Newington
Labour hold

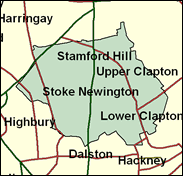
Hackney is by many standards the most deprived London Borough. It suffers from poor housing (only 32 per cent was owner-occupied in this seat at the time of the 1991 Census, and only 22 per cent in Hackney South), and both the private and council rented sectors have severe problems; well publicised difficulties with state schools (such as the now closed Hackney Downs) and virtually no viable alternatives; high unemployment, especially among the ethnic minorities, which reach more than a third of the total population here; and poor relations between some sections of those minorities and the police, especially in Stoke Newington. There is a very different community here, the Orthodox Jewish area of Stamford Hill, which maintains strong family traditions and elects Conservative councillors such as Joe Lobenstein; and in local elections the local Labour party has suffered divisions and accusations which have severely sullied its reputation and performance in borough elections. Through all this Diane Abbott has won the North parliamentary seat easily since 1987, and will probably do so again in 2001. She may well benefit from her lack of a close association with the New Labour authorities in government.

Diane Abbott, one of Labour's 10 non-white MPs, won the seat in 1987 and joins her Campaign Group colleagues in most of the revolts against the Blair Government. An intelligent but pugnacious and emotional extrovert who overstates and under-prepares, she was born - to Jamaican parents - in 1953, educated at Harrow County Grammar School for Girls and Newnham College, Cambridge and worked as a Home Office civil servant, TV reporter and GLC press officer. Short and chubby, her black stretch velvet evokes for some an exploding mole.
 |
| Wealthy Achievers, Suburban Areas |
0.00% |
14.99% |
0.00 |
|
| Affluent Greys, Rural Communities |
0.00% |
2.13% |
0.00 |
|
| Prosperous Pensioners, Retirement Areas |
0.00% |
2.49% |
0.00 |
|
| Affluent Executives, Family Areas |
0.00% |
4.43% |
0.00 |
|
| Well-Off Workers, Family Areas |
0.00% |
7.27% |
0.00 |
|
| Affluent Urbanites, Town & City Areas |
3.60% |
2.56% |
140.54 |
|
| Prosperous Professionals, Metropolitan Areas |
9.49% |
2.04% |
465.16 |
|
| Better-Off Executives, Inner City Areas |
26.71% |
3.94% |
677.21 |
|
| Comfortable Middle Agers, Mature Home Owning Areas |
0.00% |
13.04% |
0.00 |
|
| Skilled Workers, Home Owning Areas |
0.00% |
12.70% |
0.00 |
|
| New Home Owners, Mature Communities |
0.00% |
8.14% |
0.00 |
|
| White Collar Workers, Better-Off Multi Ethnic Areas |
9.86% |
4.02% |
245.29 |
|
| Older People, Less Prosperous Areas |
0.00% |
3.19% |
0.00 |
|
| Council Estate Residents, Better-Off Homes |
0.00% |
11.31% |
0.00 |
|
| Council Estate Residents, High Unemployment |
9.38% |
3.06% |
306.34 |
|
| Council Estate Residents, Greatest Hardship |
0.00% |
2.52% |
0.00 |
|
| People in Multi-Ethnic, Low-Income Areas |
40.95% |
2.10% |
1,949.96 |
|
| Unclassified |
0.00% |
0.06% |
0.00 |
|
|
 |
 |
 |
| £0-5K |
9.91% |
9.41% |
105.30 |
|
| £5-10K |
14.20% |
16.63% |
85.37 |
|
| £10-15K |
14.08% |
16.58% |
84.90 |
|
| £15-20K |
12.06% |
13.58% |
88.77 |
|
| £20-25K |
9.78% |
10.39% |
94.08 |
|
| £25-30K |
7.76% |
7.77% |
99.86 |
|
| £30-35K |
6.12% |
5.79% |
105.72 |
|
| £35-40K |
4.83% |
4.33% |
111.52 |
|
| £40-45K |
3.83% |
3.27% |
117.19 |
|
| £45-50K |
3.05% |
2.48% |
122.71 |
|
| £50-55K |
2.44% |
1.90% |
128.08 |
|
| £55-60K |
1.97% |
1.47% |
133.32 |
|
| £60-65K |
1.59% |
1.15% |
138.45 |
|
| £65-70K |
1.30% |
0.91% |
143.46 |
|
| £70-75K |
1.07% |
0.72% |
148.39 |
|
| £75-80K |
0.88% |
0.57% |
153.24 |
|
| £80-85K |
0.73% |
0.46% |
158.03 |
|
| £85-90K |
0.61% |
0.37% |
162.76 |
|
| £90-95K |
0.51% |
0.31% |
167.45 |
|
| £95-100K |
0.43% |
0.25% |
172.10 |
|
| £100K + |
2.77% |
1.34% |
206.27 |
|
|
|

|


|
1992-1997
|
1997-2001
|
|
|
|
| Con |
-10.21% |
| Lab |
6.46% |
| LD |
0.09% |
|
| Con |
-1.73% |
| Lab |
-3.22% |
| LD |
2.49% |
|
|
 |
Diane Abbott
Labour hold
|
| Con |
 |
4,430 |
14.96% |
| Lab |
 |
18,081 |
61.04% |
| LD |
 |
4,170 |
14.08% |
| Oth |
 |
2,940 |
9.93% |
| Maj |
 |
13,651 |
46.09% |
| Turn |
 |
29,621 |
49.01% |
|
|
 |
Diane Abbott
Labour hold
|
| L |
Diane Abbott |
18,081 |
61.04% |
| SL |
Sukart Chandan |
756 |
2.55% |
| G |
Chit Yet Chong |
2,184 |
7.37% |
| C |
Pauline Dye |
4,430 |
14.96% |
| LD |
Meral Ece |
4,170 |
14.08% |
|
Candidates representing 5 parties stood for election to this seat.
|
|
 |
Diane Abbott
Labour
|
| Con |
 |
5,483 |
16.69% |
| Lab |
 |
21,110 |
64.26% |
| LD |
 |
3,806 |
11.59% |
| Ref |
 |
544 |
1.66% |
| Oth |
 |
1,909 |
5.81% |
| Maj |
 |
15,627 |
47.57% |
| Turn |
 |
32,852 |
52.95% |
|
|
 |
|
Labour
|
| Con |
 |
9,356 |
26.90% |
| Lab |
 |
20,083 |
57.80% |
| LD |
 |
3,996 |
11.50% |
| Oth |
 |
1,289 |
3.70% |
| Maj |
 |
10,727 |
30.90% |
| Turn |
 |
34,724 |
53.42% |
|
|
 |
|

|

