|
Havant
Conservative hold

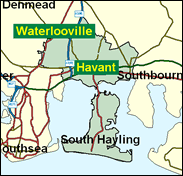
Situated just north of Portsmouth, Havant is a much larger population centre than is commonly thought. The population of the borough of Havant increased from 35,000 in 1951 to 109,000 in 1971, and some wards have even had to be transferred from this seat bearing its name to Hampshire East. The seat is not particularly middle class, and has a relatively low proportion of voters with advanced educational qualifications; and there are large council estates in the seat in wards like Barncroft, Battins, Bondfields and Warren Park. Yet like other seats in the Portsmouth area (Gosport, Fareham) Havant has demonstrated a consistent loyalty to the Right, and if it is not intellectual itself, it certainly has no objection to returning a multiple brainbox as MP, David Willetts.

David Willetts, currently Shadow Social Security Secretary, whose two brains did not stop him dissembling over Neil Hamilton, co-authored the book "Is Conservatism Dead?" and concluded it wasn't, so long as one meant "civic conservatism", aka a further retreat of the State. Born 1956 and educated at King Edward's School, Birmingham and Christ Church, Oxford, he spent his entire life as a policy worker for Tory ministers or at the Centre for Policy Studies, until election here in 1992. Apart from his slip-up over Sir Geoffrey Johnson-Smith's "wanting" advice on Neil Hamilton, his rise has been effortless, as befits the professional politician, trimming as required. Otherwise "massively clever", but without "bottomless reserves of humour", he has drawn the short straw as drafter of the Conservative election manifesto.
 |
| Wealthy Achievers, Suburban Areas |
22.54% |
14.99% |
150.30 |
|
| Affluent Greys, Rural Communities |
1.42% |
2.13% |
66.96 |
|
| Prosperous Pensioners, Retirement Areas |
4.64% |
2.49% |
186.68 |
|
| Affluent Executives, Family Areas |
0.40% |
4.43% |
8.93 |
|
| Well-Off Workers, Family Areas |
6.23% |
7.27% |
85.70 |
|
| Affluent Urbanites, Town & City Areas |
0.93% |
2.56% |
36.20 |
|
| Prosperous Professionals, Metropolitan Areas |
0.18% |
2.04% |
8.98 |
|
| Better-Off Executives, Inner City Areas |
0.46% |
3.94% |
11.77 |
|
| Comfortable Middle Agers, Mature Home Owning Areas |
15.58% |
13.04% |
119.49 |
|
| Skilled Workers, Home Owning Areas |
10.83% |
12.70% |
85.26 |
|
| New Home Owners, Mature Communities |
8.74% |
8.14% |
107.35 |
|
| White Collar Workers, Better-Off Multi Ethnic Areas |
0.62% |
4.02% |
15.41 |
|
| Older People, Less Prosperous Areas |
2.57% |
3.19% |
80.78 |
|
| Council Estate Residents, Better-Off Homes |
22.30% |
11.31% |
197.16 |
|
| Council Estate Residents, High Unemployment |
1.00% |
3.06% |
32.68 |
|
| Council Estate Residents, Greatest Hardship |
1.55% |
2.52% |
61.47 |
|
| People in Multi-Ethnic, Low-Income Areas |
0.00% |
2.10% |
0.00 |
|
| Unclassified |
0.00% |
0.06% |
0.00 |
|
|
 |
 |
 |
| £0-5K |
9.68% |
9.41% |
102.88 |
|
| £5-10K |
18.09% |
16.63% |
108.76 |
|
| £10-15K |
17.86% |
16.58% |
107.72 |
|
| £15-20K |
14.17% |
13.58% |
104.30 |
|
| £20-25K |
10.44% |
10.39% |
100.44 |
|
| £25-30K |
7.53% |
7.77% |
96.83 |
|
| £30-35K |
5.43% |
5.79% |
93.66 |
|
| £35-40K |
3.94% |
4.33% |
90.95 |
|
| £40-45K |
2.89% |
3.27% |
88.64 |
|
| £45-50K |
2.15% |
2.48% |
86.67 |
|
| £50-55K |
1.62% |
1.90% |
84.98 |
|
| £55-60K |
1.23% |
1.47% |
83.53 |
|
| £60-65K |
0.95% |
1.15% |
82.27 |
|
| £65-70K |
0.74% |
0.91% |
81.16 |
|
| £70-75K |
0.58% |
0.72% |
80.20 |
|
| £75-80K |
0.46% |
0.57% |
79.34 |
|
| £80-85K |
0.36% |
0.46% |
78.58 |
|
| £85-90K |
0.29% |
0.37% |
77.91 |
|
| £90-95K |
0.24% |
0.31% |
77.31 |
|
| £95-100K |
0.19% |
0.25% |
76.78 |
|
| £100K + |
1.01% |
1.34% |
74.94 |
|
|
|

|


|
1992-1997
|
1997-2001
|
|
|
|
| Con |
-13.16% |
| Lab |
12.22% |
| LD |
-3.74% |
|
| Con |
4.20% |
| Lab |
1.51% |
| LD |
-3.80% |
|
|
 |
David Willetts
Conservative hold
|
| Con |
 |
17,769 |
43.94% |
| Lab |
 |
13,562 |
33.54% |
| LD |
 |
7,508 |
18.57% |
| Oth |
 |
1,598 |
3.95% |
| Maj |
 |
4,207 |
10.40% |
| Turn |
 |
40,437 |
57.56% |
|
|
 |
David Willetts
Conservative hold
|
| LD |
Helana Coles |
7,508 |
18.57% |
| UK |
Tim Cuell |
561 |
1.39% |
| L |
Peter Guthrie |
13,562 |
33.54% |
| G |
Kevin Jacks |
793 |
1.96% |
| I |
Roy Stanley |
244 |
0.60% |
| C |
David Willetts |
17,769 |
43.94% |
|
Candidates representing 6 parties stood for election to this seat.
|
|
 |
David Willetts
Conservative
|
| Con |
 |
19,204 |
39.74% |
| Lab |
 |
15,475 |
32.02% |
| LD |
 |
10,806 |
22.36% |
| Ref |
 |
2,395 |
4.96% |
| Oth |
 |
442 |
0.91% |
| Maj |
 |
3,729 |
7.72% |
| Turn |
 |
48,322 |
70.63% |
|
|
 |
|
Conservative
|
| Con |
 |
27,981 |
52.90% |
| Lab |
 |
10,465 |
19.80% |
| LD |
 |
13,812 |
26.10% |
| Oth |
 |
678 |
1.30% |
| Maj |
 |
14,169 |
26.80% |
| Turn |
 |
52,936 |
77.25% |
|
|
 |
|

|

