|
New Forest West
Conservative hold

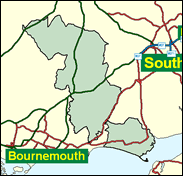
The safer half of the forest by some way for the Conservatives, West lacks its neighbour's industrial element. It too has names of communities associated with the Forest, including the largest, Lymington and Ringwood, but also stretches almost to Christchurch to include New Milton and as far north up the Avon valley to Fordingbridge. The Labour advance was much weaker here than in New Forest East, and the Liberal Democrat performance even more disappointing for them, and Desmond Swayne has a safe seat here.

Desmond Swayne, made a Health spokesman in February this year, attracts a good deal of Labour mockery for his sub-Wintertonesque rightwing bombast delivered in the style of one of Harry Enfield’s caricatures. With his low hairline eliciting werewolf howls, he allegedly stood over a King’s Cross beggar until he had eaten a tuna-filled baguette he had given him and then told him to go home because he was no longer hungry. Born 1956 and educated at Bedford School and St. Andrew’s University, he was a public school master for seven years and then a computer systems manager with a bank. He and his New Forest neighbour, Julian Lewis, are a vintage pair of bookends.
 |
| Wealthy Achievers, Suburban Areas |
26.15% |
14.99% |
174.41 |
|
| Affluent Greys, Rural Communities |
1.03% |
2.13% |
48.24 |
|
| Prosperous Pensioners, Retirement Areas |
29.06% |
2.49% |
1,168.78 |
|
| Affluent Executives, Family Areas |
3.03% |
4.43% |
68.46 |
|
| Well-Off Workers, Family Areas |
2.03% |
7.27% |
27.88 |
|
| Affluent Urbanites, Town & City Areas |
0.44% |
2.56% |
17.17 |
|
| Prosperous Professionals, Metropolitan Areas |
0.00% |
2.04% |
0.00 |
|
| Better-Off Executives, Inner City Areas |
0.00% |
3.94% |
0.00 |
|
| Comfortable Middle Agers, Mature Home Owning Areas |
24.38% |
13.04% |
186.99 |
|
| Skilled Workers, Home Owning Areas |
2.76% |
12.70% |
21.75 |
|
| New Home Owners, Mature Communities |
8.85% |
8.14% |
108.63 |
|
| White Collar Workers, Better-Off Multi Ethnic Areas |
0.00% |
4.02% |
0.00 |
|
| Older People, Less Prosperous Areas |
0.29% |
3.19% |
8.97 |
|
| Council Estate Residents, Better-Off Homes |
1.34% |
11.31% |
11.82 |
|
| Council Estate Residents, High Unemployment |
0.66% |
3.06% |
21.41 |
|
| Council Estate Residents, Greatest Hardship |
0.00% |
2.52% |
0.00 |
|
| People in Multi-Ethnic, Low-Income Areas |
0.00% |
2.10% |
0.00 |
|
| Unclassified |
0.00% |
0.06% |
0.00 |
|
|
 |
 |
 |
| £0-5K |
9.07% |
9.41% |
96.35 |
|
| £5-10K |
16.11% |
16.63% |
96.86 |
|
| £10-15K |
16.53% |
16.58% |
99.68 |
|
| £15-20K |
13.83% |
13.58% |
101.84 |
|
| £20-25K |
10.71% |
10.39% |
103.09 |
|
| £25-30K |
8.05% |
7.77% |
103.60 |
|
| £30-35K |
6.00% |
5.79% |
103.60 |
|
| £35-40K |
4.47% |
4.33% |
103.23 |
|
| £40-45K |
3.35% |
3.27% |
102.63 |
|
| £45-50K |
2.53% |
2.48% |
101.88 |
|
| £50-55K |
1.92% |
1.90% |
101.04 |
|
| £55-60K |
1.48% |
1.47% |
100.15 |
|
| £60-65K |
1.14% |
1.15% |
99.25 |
|
| £65-70K |
0.89% |
0.91% |
98.34 |
|
| £70-75K |
0.70% |
0.72% |
97.45 |
|
| £75-80K |
0.56% |
0.57% |
96.59 |
|
| £80-85K |
0.44% |
0.46% |
95.75 |
|
| £85-90K |
0.36% |
0.37% |
94.95 |
|
| £90-95K |
0.29% |
0.31% |
94.18 |
|
| £95-100K |
0.23% |
0.25% |
93.45 |
|
| £100K + |
1.20% |
1.34% |
89.53 |
|
|
|

|


|
1992-1997
|
1997-2001
|
|
|
|
| Con |
-10.15% |
| Lab |
6.06% |
| LD |
-2.73% |
|
| Con |
5.19% |
| Lab |
0.45% |
| LD |
-1.95% |
|
|
 |
Desmond Swayne
Conservative hold
|
| Con |
 |
24,575 |
55.74% |
| Lab |
 |
6,481 |
14.70% |
| LD |
 |
11,384 |
25.82% |
| Oth |
 |
1,647 |
3.74% |
| Maj |
 |
13,191 |
29.92% |
| Turn |
 |
44,087 |
65.02% |
|
|
 |
Desmond Swayne
Conservative hold
|
| LD |
Mike Bignell |
11,384 |
25.82% |
| UK |
Michael Clark |
1,647 |
3.74% |
| L |
Crada Onuegbu |
6,481 |
14.70% |
| C |
Desmond Swayne |
24,575 |
55.74% |
|
Candidates representing 4 parties stood for election to this seat.
|
|
 |
Desmond Swayne
Conservative
|
| Con |
 |
25,149 |
50.55% |
| Lab |
 |
7,092 |
14.26% |
| LD |
 |
13,817 |
27.77% |
| Ref |
 |
2,150 |
4.32% |
| Oth |
 |
1,542 |
3.10% |
| Maj |
 |
11,332 |
22.78% |
| Turn |
 |
49,750 |
74.79% |
|
|
 |
|
Conservative
|
| Con |
 |
30,982 |
60.70% |
| Lab |
 |
4,179 |
8.20% |
| LD |
 |
15,583 |
30.50% |
| Oth |
 |
293 |
0.60% |
| Maj |
 |
15,399 |
30.20% |
| Turn |
 |
51,037 |
79.85% |
|
|
 |
|

|

