|
Newcastle upon Tyne Central
Labour hold

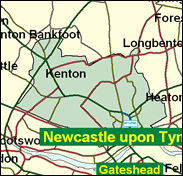
Central does not as the name implies include the bulk of the lively centre or the Tyneside frontage of the proud Geordie city of Newcastle (see Tyne Bridge constituency). Rather it surrounds town Moor, the large stretch of open land north of the centre, which has some desirable and upmarket housing. However, to say that the seat named Central is, unusually the Tories' best in a large city is not saying very much in this case. Although with some boundary changes it was won by Piers Merchant for one term in 1983 (he later made a less than glorious reappearance as MP for Beckenham), it is now held by Jim Cousins with a majority of nearly 16,500 and no longer appears on any list of marginals.

Jim Cousins, a bearded replica of the late John Osborne, and with a related right to look back in anger at his dismissal from the front bench in 1995 for going AWOL with Ann Clwyd among the Kurds, was elected here in 1987. He was born 1944, educated at City of London School, New College Oxford and LSE and worked as a lecturer and contract researcher with trade unions. Cerebral and aloof, and a Beckett not Blair supporter in 1994, he had resisted the Gulf War in 1990 and after his dismissal in 1995 has been an assiduous questioner and vocal north-east regionalist. He voted against the government on predatory pricing of the Murdoch press and on incapacity benefit cuts.
 |
| Wealthy Achievers, Suburban Areas |
6.32% |
14.99% |
42.17 |
|
| Affluent Greys, Rural Communities |
0.07% |
2.13% |
3.26 |
|
| Prosperous Pensioners, Retirement Areas |
1.20% |
2.49% |
48.32 |
|
| Affluent Executives, Family Areas |
1.28% |
4.43% |
28.83 |
|
| Well-Off Workers, Family Areas |
2.58% |
7.27% |
35.49 |
|
| Affluent Urbanites, Town & City Areas |
13.26% |
2.56% |
516.93 |
|
| Prosperous Professionals, Metropolitan Areas |
7.32% |
2.04% |
358.80 |
|
| Better-Off Executives, Inner City Areas |
26.38% |
3.94% |
668.84 |
|
| Comfortable Middle Agers, Mature Home Owning Areas |
4.37% |
13.04% |
33.53 |
|
| Skilled Workers, Home Owning Areas |
1.20% |
12.70% |
9.43 |
|
| New Home Owners, Mature Communities |
7.21% |
8.14% |
88.48 |
|
| White Collar Workers, Better-Off Multi Ethnic Areas |
2.74% |
4.02% |
68.22 |
|
| Older People, Less Prosperous Areas |
3.45% |
3.19% |
108.27 |
|
| Council Estate Residents, Better-Off Homes |
8.65% |
11.31% |
76.46 |
|
| Council Estate Residents, High Unemployment |
9.80% |
3.06% |
320.02 |
|
| Council Estate Residents, Greatest Hardship |
4.16% |
2.52% |
165.05 |
|
| People in Multi-Ethnic, Low-Income Areas |
0.00% |
2.10% |
0.00 |
|
| Unclassified |
0.02% |
0.06% |
29.51 |
|
|
 |
 |
 |
| £0-5K |
12.67% |
9.41% |
134.62 |
|
| £5-10K |
19.25% |
16.63% |
115.71 |
|
| £10-15K |
16.81% |
16.58% |
101.40 |
|
| £15-20K |
12.58% |
13.58% |
92.63 |
|
| £20-25K |
9.12% |
10.39% |
87.78 |
|
| £25-30K |
6.64% |
7.77% |
85.46 |
|
| £30-35K |
4.91% |
5.79% |
84.76 |
|
| £35-40K |
3.69% |
4.33% |
85.09 |
|
| £40-45K |
2.81% |
3.27% |
86.05 |
|
| £45-50K |
2.17% |
2.48% |
87.40 |
|
| £50-55K |
1.69% |
1.90% |
88.97 |
|
| £55-60K |
1.34% |
1.47% |
90.67 |
|
| £60-65K |
1.06% |
1.15% |
92.41 |
|
| £65-70K |
0.85% |
0.91% |
94.16 |
|
| £70-75K |
0.69% |
0.72% |
95.89 |
|
| £75-80K |
0.56% |
0.57% |
97.57 |
|
| £80-85K |
0.46% |
0.46% |
99.19 |
|
| £85-90K |
0.38% |
0.37% |
100.74 |
|
| £90-95K |
0.31% |
0.31% |
102.23 |
|
| £95-100K |
0.26% |
0.25% |
103.64 |
|
| £100K + |
1.49% |
1.34% |
110.70 |
|
|
|

|


|
1992-1997
|
1997-2001
|
|
|
|
| Con |
-12.18% |
| Lab |
7.47% |
| LD |
2.30% |
|
| Con |
-2.15% |
| Lab |
-4.20% |
| LD |
6.70% |
|
|
 |
Jim Cousins
Labour hold
|
| Con |
 |
7,414 |
21.26% |
| Lab |
 |
19,169 |
54.97% |
| LD |
 |
7,564 |
21.69% |
| Oth |
 |
723 |
2.07% |
| Maj |
 |
11,605 |
33.28% |
| Turn |
 |
34,870 |
51.30% |
|
|
 |
Jim Cousins
Labour hold
|
| L |
Jim Cousins |
19,169 |
54.97% |
| SL |
Gordon Potts |
723 |
2.07% |
| LD |
Stephen Psallidas |
7,564 |
21.69% |
| C |
Aidan Ruff |
7,414 |
21.26% |
|
Candidates representing 4 parties stood for election to this seat.
|
|
 |
Jim Cousins
Labour
|
| Con |
 |
10,792 |
23.42% |
| Lab |
 |
27,272 |
59.17% |
| LD |
 |
6,911 |
15.00% |
| Ref |
 |
1,113 |
2.41% |
| Oth |
|
0 |
0.00% |
| Maj |
 |
16,480 |
35.76% |
| Turn |
 |
46,088 |
66.05% |
|
|
 |
|
Labour
|
| Con |
 |
17,393 |
35.60% |
| Lab |
 |
25,281 |
51.70% |
| LD |
 |
6,208 |
12.70% |
| Oth |
|
0 |
0.00% |
| Maj |
 |
7,888 |
16.10% |
| Turn |
 |
48,882 |
70.46% |
|
|
 |
|

|

