|
Newcastle upon Tyne East & Wallsend
Labour hold

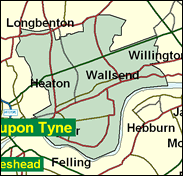
One of four utterly safe seats in Newcastle, if we include see Tyne Bridge which does after all include most of the city centre, East and Wallsend could hardly be a less rural seat for Agriculture Secretary Nick Brown. The eastern end of Hadrian's Wall may have been here, but it is buried beneath an urban and industrial agglomeration of docks and housing. Wallsend used to have a seat named after it, but that included the substantial middle class community of Gosforth (now in Newcastle North) and the only leafy enclave now is Jesmond Dene, and even that is cosmopolitan and multi-occupied, for example by students, to a degree. More typical, and nearer to the Tyne, are Walker and Walkergate and Byker, home of the acclaimed imaginative post war council evelopment known as the Byker Wall; a more relevant wall to the political complexion here than Hadrian's.

Nick Brown, lugubrious-looking Agriculture Minister, cuts a somewhat hapless figure trudging round the farmsteads of England in the wake of foot and mouth disease. A Beckett not Blair supporter, and one of Gordon Brown's backers in his unlaunched leadership bid, he was sidelined from Chief Whip to Agriculture in Blair's first reshuffle in 1998. Born in 1950 and educated at a secondary modern and at a technical school in Tunbridge Wells, and at Newcastle University, he worked in advertising at Proctor & Gamble until elected to replace SDP defecting MP Mike Thomas in 1983. He is one of half a dozen Labour MPs whose homosexuality has been acknowledged. As Chief Whip he applied the thumbscrews to a clutch of MPs accused of dissidence or alleged malefactions.
 |
| Wealthy Achievers, Suburban Areas |
4.06% |
14.99% |
27.07 |
|
| Affluent Greys, Rural Communities |
0.00% |
2.13% |
0.00 |
|
| Prosperous Pensioners, Retirement Areas |
1.37% |
2.49% |
55.09 |
|
| Affluent Executives, Family Areas |
1.66% |
4.43% |
37.48 |
|
| Well-Off Workers, Family Areas |
4.13% |
7.27% |
56.72 |
|
| Affluent Urbanites, Town & City Areas |
3.56% |
2.56% |
138.90 |
|
| Prosperous Professionals, Metropolitan Areas |
2.02% |
2.04% |
99.09 |
|
| Better-Off Executives, Inner City Areas |
9.24% |
3.94% |
234.32 |
|
| Comfortable Middle Agers, Mature Home Owning Areas |
10.27% |
13.04% |
78.74 |
|
| Skilled Workers, Home Owning Areas |
7.77% |
12.70% |
61.17 |
|
| New Home Owners, Mature Communities |
7.41% |
8.14% |
90.98 |
|
| White Collar Workers, Better-Off Multi Ethnic Areas |
0.41% |
4.02% |
10.20 |
|
| Older People, Less Prosperous Areas |
4.84% |
3.19% |
151.92 |
|
| Council Estate Residents, Better-Off Homes |
25.12% |
11.31% |
222.13 |
|
| Council Estate Residents, High Unemployment |
9.34% |
3.06% |
305.08 |
|
| Council Estate Residents, Greatest Hardship |
8.80% |
2.52% |
349.35 |
|
| People in Multi-Ethnic, Low-Income Areas |
0.00% |
2.10% |
0.00 |
|
| Unclassified |
0.00% |
0.06% |
0.00 |
|
|
 |
 |
 |
| £0-5K |
15.66% |
9.41% |
166.37 |
|
| £5-10K |
23.47% |
16.63% |
141.11 |
|
| £10-15K |
19.43% |
16.58% |
117.17 |
|
| £15-20K |
13.43% |
13.58% |
98.91 |
|
| £20-25K |
8.86% |
10.39% |
85.21 |
|
| £25-30K |
5.81% |
7.77% |
74.78 |
|
| £30-35K |
3.86% |
5.79% |
66.66 |
|
| £35-40K |
2.61% |
4.33% |
60.23 |
|
| £40-45K |
1.80% |
3.27% |
55.05 |
|
| £45-50K |
1.26% |
2.48% |
50.80 |
|
| £50-55K |
0.90% |
1.90% |
47.28 |
|
| £55-60K |
0.65% |
1.47% |
44.32 |
|
| £60-65K |
0.48% |
1.15% |
41.80 |
|
| £65-70K |
0.36% |
0.91% |
39.63 |
|
| £70-75K |
0.27% |
0.72% |
37.75 |
|
| £75-80K |
0.21% |
0.57% |
36.10 |
|
| £80-85K |
0.16% |
0.46% |
34.64 |
|
| £85-90K |
0.12% |
0.37% |
33.34 |
|
| £90-95K |
0.10% |
0.31% |
32.17 |
|
| £95-100K |
0.08% |
0.25% |
31.11 |
|
| £100K + |
0.35% |
1.34% |
26.26 |
|
|
|

|


|
1992-1997
|
1997-2001
|
|
|
|
| Con |
-8.56% |
| Lab |
13.99% |
| LD |
-8.08% |
|
| Con |
-2.09% |
| Lab |
-8.05% |
| LD |
9.02% |
|
|
 |
Nick Brown
Labour hold
|
| Con |
 |
3,873 |
11.85% |
| Lab |
 |
20,642 |
63.14% |
| LD |
 |
6,419 |
19.63% |
| Oth |
 |
1,760 |
5.38% |
| Maj |
 |
14,223 |
43.50% |
| Turn |
 |
32,694 |
53.17% |
|
|
 |
Nick Brown
Labour hold
|
| L |
Nick Brown |
20,642 |
63.14% |
| SL |
Blanch Carpenter |
420 |
1.28% |
| G |
Andrew Gray |
651 |
1.99% |
| CM |
Martin Levy |
126 |
0.39% |
| I |
Harash Narang |
563 |
1.72% |
| LD |
David Ord |
6,419 |
19.63% |
| C |
Tim Troman |
3,873 |
11.85% |
|
Candidates representing 7 parties stood for election to this seat.
|
|
 |
Nick Brown
Labour
|
| Con |
 |
5,796 |
13.94% |
| Lab |
 |
29,607 |
71.19% |
| LD |
 |
4,415 |
10.62% |
| Ref |
 |
966 |
2.32% |
| Oth |
 |
805 |
1.94% |
| Maj |
 |
23,811 |
57.25% |
| Turn |
 |
41,589 |
65.73% |
|
|
 |
|
Labour
|
| Con |
 |
10,421 |
22.50% |
| Lab |
 |
26,466 |
57.20% |
| LD |
 |
8,628 |
18.70% |
| Oth |
 |
744 |
1.60% |
| Maj |
 |
16,045 |
34.70% |
| Turn |
 |
46,259 |
70.10% |
|
|
 |
|

|

