|
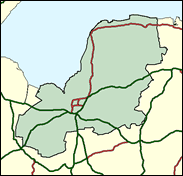
Norfolk North West
Conservative gain

The north coast of Norfolk will be far from a forgotten backwater at the next general election. This corner of the land will see two dramatic fights of differing natures. In North Norfolk the Liberal Democrats will be striving for their first win in the county since before the Second World War. Here in North West, based on King's Lynn, Labour will be trying to hold on in what is probably their most rural seat in England (certainly one of only three where more than 2,000 workers were employed in farming at the time of the last Census), with a majority from 1997 of just 1,339 in what is very much a two-sided contest against Henry Bellingham, trying again for the Conservatives. Of course Labour do not need to hold seats like this in order to retain a handsome overall majority in the Commons; but George Turner will forget that, as he defends his very own seat. The Conservatives were 8pc ahead in the King's Lynn and West Norfolk local elections in May 1999, but nine predominantly Conservative wards from that local authority are actually in Norfolk South West, and another close result cannot be ruled out, although Bellingham is favourite to regain his place on the green benches. This is one of very few seats where rural issues may be decisive, not least crime, following the murder conviction of Tony Martin, a farmer who shot a teenage burgler.

Dr George Turner, MP here since 1997, has operated as a necessarily diligent constituency MP concerned about alien Yorkshire Television being beamed into Norfolk and taking a nuanced pragmatic line on hunting, and warning Labour rebels not to cherry-pick the Manifesto. Born 1940 of Scots migrants in Corby, he was educated at Laxton Grammar School, Oundle and Imperial College London, and lectured in electronic engineering at East Anglia University. The seat should be vulnerable to its former Tory MP Henry Bellingham, who lost to Turner after 14 years in 1997. Born 1955, former friend of Princess Diana, he would restore a patrician whiff of rolling acres as an Eton and Magdalen-educated landowner, barrister and Member of Lloyds, owning a stud and opposed to gun control and right-to-roam legislation. He carried Malcolm Rifkind's bags as PPS for seven years.
 |
| Wealthy Achievers, Suburban Areas |
10.18% |
14.99% |
67.86 |
|
| Affluent Greys, Rural Communities |
9.94% |
2.13% |
467.37 |
|
| Prosperous Pensioners, Retirement Areas |
11.26% |
2.49% |
453.08 |
|
| Affluent Executives, Family Areas |
5.15% |
4.43% |
116.36 |
|
| Well-Off Workers, Family Areas |
4.59% |
7.27% |
63.10 |
|
| Affluent Urbanites, Town & City Areas |
0.00% |
2.56% |
0.00 |
|
| Prosperous Professionals, Metropolitan Areas |
0.00% |
2.04% |
0.00 |
|
| Better-Off Executives, Inner City Areas |
0.49% |
3.94% |
12.44 |
|
| Comfortable Middle Agers, Mature Home Owning Areas |
24.99% |
13.04% |
191.62 |
|
| Skilled Workers, Home Owning Areas |
7.68% |
12.70% |
60.45 |
|
| New Home Owners, Mature Communities |
9.61% |
8.14% |
118.03 |
|
| White Collar Workers, Better-Off Multi Ethnic Areas |
2.95% |
4.02% |
73.40 |
|
| Older People, Less Prosperous Areas |
1.61% |
3.19% |
50.57 |
|
| Council Estate Residents, Better-Off Homes |
8.08% |
11.31% |
71.40 |
|
| Council Estate Residents, High Unemployment |
1.17% |
3.06% |
38.32 |
|
| Council Estate Residents, Greatest Hardship |
2.31% |
2.52% |
91.56 |
|
| People in Multi-Ethnic, Low-Income Areas |
0.00% |
2.10% |
0.00 |
|
| Unclassified |
0.00% |
0.06% |
0.00 |
|
|
 |
 |
 |
| £0-5K |
11.03% |
9.41% |
117.15 |
|
| £5-10K |
20.37% |
16.63% |
122.49 |
|
| £10-15K |
19.39% |
16.58% |
116.96 |
|
| £15-20K |
14.75% |
13.58% |
108.61 |
|
| £20-25K |
10.38% |
10.39% |
99.90 |
|
| £25-30K |
7.13% |
7.77% |
91.66 |
|
| £30-35K |
4.87% |
5.79% |
84.15 |
|
| £35-40K |
3.35% |
4.33% |
77.42 |
|
| £40-45K |
2.33% |
3.27% |
71.43 |
|
| £45-50K |
1.64% |
2.48% |
66.12 |
|
| £50-55K |
1.17% |
1.90% |
61.42 |
|
| £55-60K |
0.84% |
1.47% |
57.24 |
|
| £60-65K |
0.62% |
1.15% |
53.54 |
|
| £65-70K |
0.46% |
0.91% |
50.24 |
|
| £70-75K |
0.34% |
0.72% |
47.29 |
|
| £75-80K |
0.26% |
0.57% |
44.65 |
|
| £80-85K |
0.20% |
0.46% |
42.27 |
|
| £85-90K |
0.15% |
0.37% |
40.14 |
|
| £90-95K |
0.12% |
0.31% |
38.20 |
|
| £95-100K |
0.09% |
0.25% |
36.45 |
|
| £100K + |
0.39% |
1.34% |
28.83 |
|
|
|

|


|
1992-1997
|
1997-2001
|
|
|
|
| Con |
-10.59% |
| Lab |
10.24% |
| LD |
-4.23% |
|
| Con |
7.01% |
| Lab |
-2.12% |
| LD |
-1.19% |
|
|
 |
Henry Bellingham
Conservative gain
|
| Con |
 |
24,846 |
48.52% |
| Lab |
 |
21,361 |
41.72% |
| LD |
 |
4,292 |
8.38% |
| Oth |
 |
704 |
1.37% |
| Maj |
 |
3,485 |
6.81% |
| Turn |
 |
51,203 |
66.16% |
|
|
 |
Henry Bellingham
Conservative gain
|
| C |
Henry Bellingham |
24,846 |
48.52% |
| UK |
Ian Durrant |
704 |
1.37% |
| LD |
Ian Mack |
4,292 |
8.38% |
| L |
George Turner |
21,361 |
41.72% |
|
Candidates representing 4 parties stood for election to this seat.
|
|
 |
George Turner
Labour gain
|
| Con |
 |
23,911 |
41.51% |
| Lab |
 |
25,250 |
43.84% |
| LD |
 |
5,513 |
9.57% |
| Ref |
 |
2,923 |
5.07% |
| Oth |
|
0 |
0.00% |
| Maj |
 |
1,339 |
2.32% |
| Turn |
 |
57,597 |
74.72% |
|
|
 |
|
Conservative
|
| Con |
 |
32,554 |
52.10% |
| Lab |
 |
20,990 |
33.60% |
| LD |
 |
8,599 |
13.80% |
| Oth |
 |
330 |
0.50% |
| Maj |
 |
11,564 |
18.50% |
| Turn |
 |
62,473 |
80.48% |
|
|
 |
|

|

