|
Oldham West & Royton
Labour hold

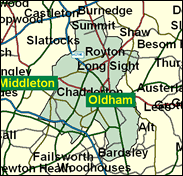
Far less closely contested than its neighbour Oldham East and Saddleworth, this seat is and will stay safely Labour. It includes two parts of Oldham, once disparate but now converging. The central wards such as Coldhurst are working class and contain a substantial section of Oldham's Muslim Asian population: it was 37pc non-white at the time of the 1991 Census and included one of the largest Bangladeshi communities in the north. The western neighbourhoods of Werneth ward once had large mansions but these are decayed and/or redeveloped, and are also notably influenced by the Asian presence. In 2000 both Coldhurst and Werneth elected Asian councillors, the former Liberal Democrat and the latter Labour. Race relations in Oldham reached unwonted and unwanted national prominence in late April 2001, although the Glodwick neighbourhood bruited as a no go area for white people, is situated east of the town centre and in the St Mary's ward in Oldham East and Saddleworth constituency. More voters are to be found in the independent towns of Royton and Chadderton. Royton elects Lib Dem councillors, Chaderton a mixture of Conservative and Labour. In General Elections though the seat poses no difficulties for Michael Meacher.

Michael Meacher, Environment Minister since 1997, elected originally for an Oldham seat in 1970, will be after the election Labour's fourth longest-running MP, and one of only three Blair ministers to have served in the pre-1979 Callaghan government. Originally a hard leftwinger who ran for the Labour Deputy Leadership against Roy Hattersley in 1983 as Tony Benn's Vicar on Earth, he was born 1939, educated at Berkhamsted School, New College Oxford and the LSE, and lectured in social administration at York University. Included in the government, but not of Cabinet rank, as a constantly elected member of the Shadow Cabinet, he had backed Prescott, not Blair in 1994. Cerebral but earnest and humourless, his career has been dogged by accusations of pretentiousness in exaggerating his father's humble origins, and of affluence, as in exposés of the number of his properties.
 |
| Wealthy Achievers, Suburban Areas |
1.99% |
14.99% |
13.30 |
|
| Affluent Greys, Rural Communities |
0.00% |
2.13% |
0.00 |
|
| Prosperous Pensioners, Retirement Areas |
0.02% |
2.49% |
0.83 |
|
| Affluent Executives, Family Areas |
2.06% |
4.43% |
46.45 |
|
| Well-Off Workers, Family Areas |
11.95% |
7.27% |
164.34 |
|
| Affluent Urbanites, Town & City Areas |
0.00% |
2.56% |
0.00 |
|
| Prosperous Professionals, Metropolitan Areas |
0.00% |
2.04% |
0.00 |
|
| Better-Off Executives, Inner City Areas |
0.48% |
3.94% |
12.06 |
|
| Comfortable Middle Agers, Mature Home Owning Areas |
7.13% |
13.04% |
54.68 |
|
| Skilled Workers, Home Owning Areas |
28.18% |
12.70% |
221.82 |
|
| New Home Owners, Mature Communities |
6.75% |
8.14% |
82.92 |
|
| White Collar Workers, Better-Off Multi Ethnic Areas |
0.22% |
4.02% |
5.45 |
|
| Older People, Less Prosperous Areas |
6.50% |
3.19% |
204.09 |
|
| Council Estate Residents, Better-Off Homes |
17.39% |
11.31% |
153.77 |
|
| Council Estate Residents, High Unemployment |
5.64% |
3.06% |
184.07 |
|
| Council Estate Residents, Greatest Hardship |
2.27% |
2.52% |
90.16 |
|
| People in Multi-Ethnic, Low-Income Areas |
9.42% |
2.10% |
448.60 |
|
| Unclassified |
0.00% |
0.06% |
0.00 |
|
|
 |
 |
 |
| £0-5K |
11.62% |
9.41% |
123.47 |
|
| £5-10K |
20.09% |
16.63% |
120.78 |
|
| £10-15K |
18.90% |
16.58% |
113.99 |
|
| £15-20K |
14.48% |
13.58% |
106.60 |
|
| £20-25K |
10.32% |
10.39% |
99.34 |
|
| £25-30K |
7.19% |
7.77% |
92.43 |
|
| £30-35K |
4.98% |
5.79% |
85.95 |
|
| £35-40K |
3.46% |
4.33% |
79.94 |
|
| £40-45K |
2.43% |
3.27% |
74.39 |
|
| £45-50K |
1.72% |
2.48% |
69.29 |
|
| £50-55K |
1.23% |
1.90% |
64.62 |
|
| £55-60K |
0.89% |
1.47% |
60.35 |
|
| £60-65K |
0.65% |
1.15% |
56.44 |
|
| £65-70K |
0.48% |
0.91% |
52.87 |
|
| £70-75K |
0.36% |
0.72% |
49.60 |
|
| £75-80K |
0.27% |
0.57% |
46.61 |
|
| £80-85K |
0.20% |
0.46% |
43.87 |
|
| £85-90K |
0.15% |
0.37% |
41.35 |
|
| £90-95K |
0.12% |
0.31% |
39.04 |
|
| £95-100K |
0.09% |
0.25% |
36.91 |
|
| £100K + |
0.37% |
1.34% |
27.21 |
|
|
|

|


|
1992-1997
|
1997-2001
|
|
|
|
| Con |
-14.72% |
| Lab |
9.70% |
| LD |
0.48% |
|
| Con |
-5.67% |
| Lab |
-7.65% |
| LD |
0.57% |
|
|
 |
Michael Meacher
Labour hold
|
| Con |
 |
7,076 |
17.71% |
| Lab |
 |
20,441 |
51.15% |
| LD |
 |
4,975 |
12.45% |
| Oth |
 |
7,470 |
18.69% |
| Maj |
 |
13,365 |
33.44% |
| Turn |
 |
39,962 |
57.57% |
|
|
 |
Michael Meacher
Labour hold
|
| BNP |
Nick Griffin |
6,552 |
16.40% |
| L |
Michael Meacher |
20,441 |
51.15% |
| LD |
Marc Ramsbottom |
4,975 |
12.45% |
| C |
Duncan Reed |
7,076 |
17.71% |
| G |
David Rooney |
918 |
2.30% |
|
Candidates representing 5 parties stood for election to this seat.
|
|
 |
Michael Meacher
Labour
|
| Con |
 |
10,693 |
23.38% |
| Lab |
 |
26,894 |
58.80% |
| LD |
 |
5,434 |
11.88% |
| Ref |
 |
1,157 |
2.53% |
| Oth |
 |
1,560 |
3.41% |
| Maj |
 |
16,201 |
35.42% |
| Turn |
 |
45,738 |
66.09% |
|
|
 |
|
Labour
|
| Con |
 |
20,093 |
38.10% |
| Lab |
 |
25,887 |
49.10% |
| LD |
 |
6,031 |
11.40% |
| Oth |
 |
722 |
1.40% |
| Maj |
 |
5,794 |
11.00% |
| Turn |
 |
52,733 |
75.01% |
|
|
 |
|

|

