|
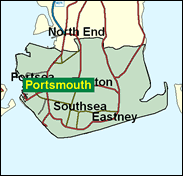
Portsmouth South
Liberal Democrat hold

If Syd Rapson and Labour are in trouble in Portsmouth North, so are the Liberal Democrats and Mike Hancock MP in South. In May 2000 the Conservatives won four of the seven wards in the local elections, and two of the others were held by Mr and Mrs Hancock (Fratton and Charles Dickens respectively). Hancock's best chance is of squeezing the large Labour vote from 1997 on tactical grounds, to prevent recapture by Philip Warr, the new Tory candidate.

Mike Hancock recaptured this seat in 1997 having held it for three years earlier after a 1984 byelection. A former Labour-then-SDP-then-Lib-Dem Portsmouth councillor for 24 years, and on Hampshire County Council, which he led 1993-97, he brings to his Party working class origins as a former engineering worker and AEU shop steward. A heavily-bearded ex-Salvationist and a sailor's son, born 1946 and educated at Copnor and Portsea School, he is a campaigner for animal welfare and for the disabled (as a former Mencap district officer).
 |
| Wealthy Achievers, Suburban Areas |
0.80% |
14.99% |
5.37 |
|
| Affluent Greys, Rural Communities |
0.10% |
2.13% |
4.76 |
|
| Prosperous Pensioners, Retirement Areas |
6.53% |
2.49% |
262.77 |
|
| Affluent Executives, Family Areas |
2.22% |
4.43% |
50.09 |
|
| Well-Off Workers, Family Areas |
0.08% |
7.27% |
1.16 |
|
| Affluent Urbanites, Town & City Areas |
5.54% |
2.56% |
215.99 |
|
| Prosperous Professionals, Metropolitan Areas |
0.95% |
2.04% |
46.34 |
|
| Better-Off Executives, Inner City Areas |
11.63% |
3.94% |
294.88 |
|
| Comfortable Middle Agers, Mature Home Owning Areas |
1.63% |
13.04% |
12.47 |
|
| Skilled Workers, Home Owning Areas |
35.52% |
12.70% |
279.66 |
|
| New Home Owners, Mature Communities |
0.48% |
8.14% |
5.89 |
|
| White Collar Workers, Better-Off Multi Ethnic Areas |
14.51% |
4.02% |
360.76 |
|
| Older People, Less Prosperous Areas |
2.45% |
3.19% |
76.94 |
|
| Council Estate Residents, Better-Off Homes |
2.12% |
11.31% |
18.73 |
|
| Council Estate Residents, High Unemployment |
8.74% |
3.06% |
285.57 |
|
| Council Estate Residents, Greatest Hardship |
5.31% |
2.52% |
210.99 |
|
| People in Multi-Ethnic, Low-Income Areas |
0.00% |
2.10% |
0.00 |
|
| Unclassified |
1.38% |
0.06% |
2,211.27 |
|
|
 |
 |
 |
| £0-5K |
11.92% |
9.41% |
126.67 |
|
| £5-10K |
19.14% |
16.63% |
115.05 |
|
| £10-15K |
17.91% |
16.58% |
108.00 |
|
| £15-20K |
13.86% |
13.58% |
102.04 |
|
| £20-25K |
10.04% |
10.39% |
96.60 |
|
| £25-30K |
7.12% |
7.77% |
91.64 |
|
| £30-35K |
5.05% |
5.79% |
87.19 |
|
| £35-40K |
3.61% |
4.33% |
83.23 |
|
| £40-45K |
2.60% |
3.27% |
79.74 |
|
| £45-50K |
1.90% |
2.48% |
76.68 |
|
| £50-55K |
1.41% |
1.90% |
74.01 |
|
| £55-60K |
1.06% |
1.47% |
71.67 |
|
| £60-65K |
0.80% |
1.15% |
69.63 |
|
| £65-70K |
0.61% |
0.91% |
67.84 |
|
| £70-75K |
0.48% |
0.72% |
66.27 |
|
| £75-80K |
0.37% |
0.57% |
64.90 |
|
| £80-85K |
0.29% |
0.46% |
63.68 |
|
| £85-90K |
0.23% |
0.37% |
62.61 |
|
| £90-95K |
0.19% |
0.31% |
61.67 |
|
| £95-100K |
0.15% |
0.25% |
60.83 |
|
| £100K + |
0.78% |
1.34% |
57.68 |
|
|
|

|


|
1992-1997
|
1997-2001
|
|
|
|
| Con |
-11.37% |
| Lab |
10.71% |
| LD |
-2.50% |
|
| Con |
-2.07% |
| Lab |
-1.44% |
| LD |
5.10% |
|
|
 |
Mike Hancock
Liberal Democrat hold
|
| Con |
 |
11,396 |
29.06% |
| Lab |
 |
9,361 |
23.87% |
| LD |
 |
17,490 |
44.60% |
| Oth |
 |
968 |
2.47% |
| Maj |
 |
6,094 |
15.54% |
| Turn |
 |
39,215 |
50.87% |
|
|
 |
Mike Hancock
Liberal Democrat hold
|
| L |
Graham Hancock |
9,361 |
23.87% |
| LD |
Mike Hancock |
17,490 |
44.60% |
| SA |
John Molyneux |
647 |
1.65% |
| UK |
Michael Tarrant |
321 |
0.82% |
| C |
Philip Warr |
11,396 |
29.06% |
|
Candidates representing 5 parties stood for election to this seat.
|
|
 |
Mike Hancock
Liberal Democrat gain
|
| Con |
 |
16,094 |
31.13% |
| Lab |
 |
13,086 |
25.31% |
| LD |
 |
20,421 |
39.50% |
| Ref |
 |
1,629 |
3.15% |
| Oth |
 |
465 |
0.90% |
| Maj |
 |
4,327 |
8.37% |
| Turn |
 |
51,695 |
64.21% |
|
|
 |
|
Conservative
|
| Con |
 |
22,798 |
42.50% |
| Lab |
 |
7,857 |
14.60% |
| LD |
 |
22,556 |
42.00% |
| Oth |
 |
440 |
0.80% |
| Maj |
 |
242 |
0.50% |
| Turn |
 |
53,651 |
69.44% |
|
|
 |
|

|

