|
Reading West
Labour hold

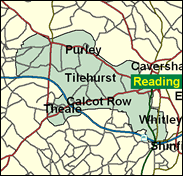
The feisty Martin Salter, a rebel in late 2000 over his party's proposal partially to sell off the air traffic control service, faces another struggle to hold his seat in the forthcoming General Election. As in Reading East, the seat is divided between Reading unitary authority wards (in this case more solidly Labour) and a more Conservatives set of suburbs, largely along the river Thames in pleasant Pangbourne, Purley, and Tilehurst. This seat requires an even smaller swing than East, just over three pc, and like East it is a toss-up to be watched very closely.

Martin Salter, an estuarially-accented cheeky-chappy, has moved from Blairite loyalism to rebellious mode on air traffic control privatisation, whilst also heading-up a campaign of resistance against bank branch closures. A former Reading Councillor (and deputy leader), elected here in 1997, he was born in 1954 and educated at Hampton Grammar School and Sussex University, and now resists overcrowding of jobs and housing in the booming Thames corridor. His possible Conservative nemesis is Stephen Reid, a computer consultant, previously recalled as the Tory who lost the Eastleigh byelection to the Liberal Democrats in 1994 and failed to win the seat back in 1997. Born 1951 and educated at Queen Mary's Grammar School, Basingstoke and Fitzwilliam College, Cambridge, as a Basingstoke councillor for seven years he claims to have sold off more council houses than any other local authority.
 |
| Wealthy Achievers, Suburban Areas |
9.86% |
14.99% |
65.78 |
|
| Affluent Greys, Rural Communities |
0.01% |
2.13% |
0.47 |
|
| Prosperous Pensioners, Retirement Areas |
1.67% |
2.49% |
66.99 |
|
| Affluent Executives, Family Areas |
9.16% |
4.43% |
207.03 |
|
| Well-Off Workers, Family Areas |
14.91% |
7.27% |
204.98 |
|
| Affluent Urbanites, Town & City Areas |
3.46% |
2.56% |
134.93 |
|
| Prosperous Professionals, Metropolitan Areas |
0.92% |
2.04% |
45.31 |
|
| Better-Off Executives, Inner City Areas |
2.37% |
3.94% |
59.98 |
|
| Comfortable Middle Agers, Mature Home Owning Areas |
14.28% |
13.04% |
109.48 |
|
| Skilled Workers, Home Owning Areas |
11.95% |
12.70% |
94.08 |
|
| New Home Owners, Mature Communities |
9.98% |
8.14% |
122.60 |
|
| White Collar Workers, Better-Off Multi Ethnic Areas |
5.32% |
4.02% |
132.38 |
|
| Older People, Less Prosperous Areas |
2.15% |
3.19% |
67.54 |
|
| Council Estate Residents, Better-Off Homes |
10.21% |
11.31% |
90.23 |
|
| Council Estate Residents, High Unemployment |
2.88% |
3.06% |
94.16 |
|
| Council Estate Residents, Greatest Hardship |
0.80% |
2.52% |
31.65 |
|
| People in Multi-Ethnic, Low-Income Areas |
0.00% |
2.10% |
0.00 |
|
| Unclassified |
0.07% |
0.06% |
111.18 |
|
|
 |
 |
 |
| £0-5K |
5.93% |
9.41% |
63.02 |
|
| £5-10K |
12.15% |
16.63% |
73.04 |
|
| £10-15K |
14.32% |
16.58% |
86.35 |
|
| £15-20K |
13.42% |
13.58% |
98.81 |
|
| £20-25K |
11.36% |
10.39% |
109.29 |
|
| £25-30K |
9.15% |
7.77% |
117.65 |
|
| £30-35K |
7.19% |
5.79% |
124.09 |
|
| £35-40K |
5.59% |
4.33% |
128.91 |
|
| £40-45K |
4.32% |
3.27% |
132.44 |
|
| £45-50K |
3.35% |
2.48% |
134.94 |
|
| £50-55K |
2.60% |
1.90% |
136.64 |
|
| £55-60K |
2.03% |
1.47% |
137.72 |
|
| £60-65K |
1.59% |
1.15% |
138.32 |
|
| £65-70K |
1.26% |
0.91% |
138.55 |
|
| £70-75K |
1.00% |
0.72% |
138.51 |
|
| £75-80K |
0.79% |
0.57% |
138.26 |
|
| £80-85K |
0.64% |
0.46% |
137.84 |
|
| £85-90K |
0.51% |
0.37% |
137.30 |
|
| £90-95K |
0.42% |
0.31% |
136.68 |
|
| £95-100K |
0.34% |
0.25% |
135.99 |
|
| £100K + |
1.75% |
1.34% |
130.40 |
|
|
|

|


|
1992-1997
|
1997-2001
|
|
|
|
| Con |
-13.46% |
| Lab |
16.44% |
| LD |
-5.08% |
|
| Con |
-6.91% |
| Lab |
7.98% |
| LD |
0.11% |
|
|
 |
Martin Salter
Labour hold
|
| Con |
 |
13,451 |
32.04% |
| Lab |
 |
22,300 |
53.11% |
| LD |
 |
5,387 |
12.83% |
| Oth |
 |
848 |
2.02% |
| Maj |
 |
8,849 |
21.08% |
| Turn |
 |
41,986 |
58.57% |
|
|
 |
Martin Salter
Labour hold
|
| UK |
David Black |
848 |
2.02% |
| LD |
Polly Martin |
5,387 |
12.83% |
| C |
Stephen Reid |
13,451 |
32.04% |
| L |
Martin Salter |
22,300 |
53.11% |
|
Candidates representing 4 parties stood for election to this seat.
|
|
 |
Martin Salter
Labour gain
|
| Con |
 |
18,844 |
38.94% |
| Lab |
 |
21,841 |
45.14% |
| LD |
 |
6,153 |
12.72% |
| Ref |
 |
976 |
2.02% |
| Oth |
 |
575 |
1.19% |
| Maj |
 |
2,997 |
6.19% |
| Turn |
 |
48,389 |
70.05% |
|
|
 |
|
Conservative
|
| Con |
 |
27,888 |
52.40% |
| Lab |
 |
15,256 |
28.70% |
| LD |
 |
9,461 |
17.80% |
| Oth |
 |
638 |
1.20% |
| Maj |
 |
12,632 |
23.70% |
| Turn |
 |
53,243 |
77.33% |
|
|
 |
|

|

