|
Surrey East
Conservative hold

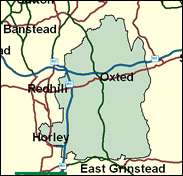
The east end of Surrey is not exactly reminiscent of the east end of London, or of any other real or metaphorical working class industrial east end, downwind of the stench of smoky factories, where people live who cannot afford attractive or even average residential accommodation. Instead, this is one of the most rural and attractive parts of the county with the highest property values in Britain and with a complete sale of 11 Conservative MPs, even after that party's greatest disaster in modern times in 1997. Surrey East still has a Tory majority of 15,093, the third highest anywhere in the land, surpassed only by John Major's Huntingdon, which may prove to be partly personal, and Surrey Heath at the opposite end of its county. It is true that the opposition is divided fairly evenly, but Peter Ainsworth did just manage an absolute majority of all votes cast, very rare for a Conservative last time. The seat consists of the largeish community of Horley near Gatwick Airport, from the Borough of Reigate (actually the most populous centre in the whole seat, with 18,000 residents) and the whole of the borough of Tandridge, based on Caterham and Warlingham and Oxted and Lingfield and villages like Godstow on the A25. In the May 2000 elections the Tories won overall control of Tandridge easily, 17pc ahead of the Liberal Democrats even in the latter's specialism, local government elections.

Peter Ainsworth. Shadow Culture Secretary, elected in 1992, is pretty well as cultured as one could wish. With handsome good looks honed in central casting, and the smooth manner of a merchant banker (Warburgs), he was born in 1956, educated at Bradfield and Lincoln College Oxford and, with the M23 ploughed straight through his constituency, is understandably worried about the environment which he sought to protect in his bill defending hedgerows from agri-farming interests. A former Wandsworth councillor, he cuts a more centrist dash than the deregulatory privatisers typical of that genre.
 |
| Wealthy Achievers, Suburban Areas |
47.11% |
14.99% |
314.19 |
|
| Affluent Greys, Rural Communities |
0.00% |
2.13% |
0.00 |
|
| Prosperous Pensioners, Retirement Areas |
1.45% |
2.49% |
58.16 |
|
| Affluent Executives, Family Areas |
3.62% |
4.43% |
81.73 |
|
| Well-Off Workers, Family Areas |
8.11% |
7.27% |
111.46 |
|
| Affluent Urbanites, Town & City Areas |
3.32% |
2.56% |
129.43 |
|
| Prosperous Professionals, Metropolitan Areas |
1.53% |
2.04% |
74.88 |
|
| Better-Off Executives, Inner City Areas |
0.54% |
3.94% |
13.77 |
|
| Comfortable Middle Agers, Mature Home Owning Areas |
22.99% |
13.04% |
176.35 |
|
| Skilled Workers, Home Owning Areas |
3.35% |
12.70% |
26.34 |
|
| New Home Owners, Mature Communities |
5.19% |
8.14% |
63.79 |
|
| White Collar Workers, Better-Off Multi Ethnic Areas |
0.17% |
4.02% |
4.10 |
|
| Older People, Less Prosperous Areas |
0.75% |
3.19% |
23.60 |
|
| Council Estate Residents, Better-Off Homes |
1.51% |
11.31% |
13.33 |
|
| Council Estate Residents, High Unemployment |
0.34% |
3.06% |
11.14 |
|
| Council Estate Residents, Greatest Hardship |
0.00% |
2.52% |
0.00 |
|
| People in Multi-Ethnic, Low-Income Areas |
0.00% |
2.10% |
0.00 |
|
| Unclassified |
0.03% |
0.06% |
49.45 |
|
|
 |
 |
 |
| £0-5K |
4.13% |
9.41% |
43.85 |
|
| £5-10K |
9.22% |
16.63% |
55.44 |
|
| £10-15K |
11.74% |
16.58% |
70.84 |
|
| £15-20K |
11.82% |
13.58% |
87.03 |
|
| £20-25K |
10.69% |
10.39% |
102.87 |
|
| £25-30K |
9.17% |
7.77% |
117.89 |
|
| £30-35K |
7.64% |
5.79% |
131.90 |
|
| £35-40K |
6.28% |
4.33% |
144.86 |
|
| £40-45K |
5.12% |
3.27% |
156.78 |
|
| £45-50K |
4.16% |
2.48% |
167.73 |
|
| £50-55K |
3.39% |
1.90% |
177.79 |
|
| £55-60K |
2.76% |
1.47% |
187.03 |
|
| £60-65K |
2.25% |
1.15% |
195.53 |
|
| £65-70K |
1.84% |
0.91% |
203.36 |
|
| £70-75K |
1.51% |
0.72% |
210.58 |
|
| £75-80K |
1.25% |
0.57% |
217.26 |
|
| £80-85K |
1.03% |
0.46% |
223.45 |
|
| £85-90K |
0.86% |
0.37% |
229.18 |
|
| £90-95K |
0.72% |
0.31% |
234.52 |
|
| £95-100K |
0.60% |
0.25% |
239.48 |
|
| £100K + |
3.54% |
1.34% |
263.46 |
|
|
|

|


|
1992-1997
|
1997-2001
|
|
|
|
| Con |
-10.99% |
| Lab |
10.67% |
| LD |
-4.40% |
|
| Con |
2.40% |
| Lab |
-2.06% |
| LD |
1.95% |
|
|
 |
Peter Ainsworth
Conservative hold
|
| Con |
 |
24,706 |
52.51% |
| Lab |
 |
8,994 |
19.12% |
| LD |
 |
11,503 |
24.45% |
| Oth |
 |
1,846 |
3.92% |
| Maj |
 |
13,203 |
28.06% |
| Turn |
 |
47,049 |
62.69% |
|
|
 |
Peter Ainsworth
Conservative hold
|
| C |
Peter Ainsworth |
24,706 |
52.51% |
| LD |
Jeremy Pursehouse |
11,503 |
24.45% |
| UK |
Anthony Stone |
1,846 |
3.92% |
| L |
Jo Tanner |
8,994 |
19.12% |
|
Candidates representing 4 parties stood for election to this seat.
|
|
 |
Peter Ainsworth
Conservative
|
| Con |
 |
27,389 |
50.11% |
| Lab |
 |
11,573 |
21.17% |
| LD |
 |
12,296 |
22.50% |
| Ref |
 |
2,656 |
4.86% |
| Oth |
 |
742 |
1.36% |
| Maj |
 |
15,093 |
27.61% |
| Turn |
 |
54,656 |
75.02% |
|
|
 |
|
Conservative
|
| Con |
 |
35,676 |
61.10% |
| Lab |
 |
6,135 |
10.50% |
| LD |
 |
15,704 |
26.90% |
| Oth |
 |
919 |
1.60% |
| Maj |
 |
19,972 |
34.20% |
| Turn |
 |
58,434 |
81.54% |
|
|
 |
|

|

