|
Walsall South
Labour hold

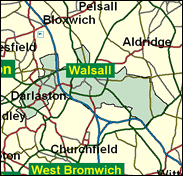
The South division has a distinctly different tone from Walsall North. Although decidedly more middle class and owner occupied, and even with a very attractive leafy residential area in Paddock ward to the south east, it is just as strongly Labour. There are more non-white residents, about half of Indian origin and a quarter of Pakistani, concentrated in the centre of Walsall in Palfrey, Pleck and St Matthew's wards. There is also the more self-contained Black Country industrial town of Darlaston. Labour has underperformed for some years in Walsall Borough elections, and in May 2000 the Tories were well ahead in the wards which make up South - but this pattern has been seen before, and the parliamentary seat has been in the hands of Labour and Bruce George since February 1974.

Bruce George, a large, bald, pot-bellied and, in his own words, "anglicised Welshman", won this seat in 1974, and has enjoyed a parliamentary career of mind-numbing repetitiveness as a backbench defence specialist, finally heading the appropriate select committee, claiming never to have been offered, nor sought, a front bench job. A policeman's son, born 1942, he attended Mountain Ash Grammar School and Swansea and Warwick Universities and was a polytechnic or open University lecturer. In trouble locally over his pro-Nato stance when the Labour Party was in thrall to left-wing activists, the later sanitising of the party has allowed him to emerge as a sage exponent of the current orthodoxies. Of rather lone disposition, and a sider with the Turks rather than the Greeks on Cyprus, he voted against homosexual sex at 16.
 |
| Wealthy Achievers, Suburban Areas |
11.08% |
14.99% |
73.87 |
|
| Affluent Greys, Rural Communities |
0.00% |
2.13% |
0.00 |
|
| Prosperous Pensioners, Retirement Areas |
0.34% |
2.49% |
13.66 |
|
| Affluent Executives, Family Areas |
2.40% |
4.43% |
54.32 |
|
| Well-Off Workers, Family Areas |
3.51% |
7.27% |
48.24 |
|
| Affluent Urbanites, Town & City Areas |
0.00% |
2.56% |
0.00 |
|
| Prosperous Professionals, Metropolitan Areas |
0.07% |
2.04% |
3.19 |
|
| Better-Off Executives, Inner City Areas |
0.81% |
3.94% |
20.50 |
|
| Comfortable Middle Agers, Mature Home Owning Areas |
5.71% |
13.04% |
43.76 |
|
| Skilled Workers, Home Owning Areas |
12.14% |
12.70% |
95.56 |
|
| New Home Owners, Mature Communities |
12.66% |
8.14% |
155.45 |
|
| White Collar Workers, Better-Off Multi Ethnic Areas |
3.64% |
4.02% |
90.40 |
|
| Older People, Less Prosperous Areas |
2.77% |
3.19% |
86.88 |
|
| Council Estate Residents, Better-Off Homes |
27.66% |
11.31% |
244.58 |
|
| Council Estate Residents, High Unemployment |
3.73% |
3.06% |
121.71 |
|
| Council Estate Residents, Greatest Hardship |
5.79% |
2.52% |
229.76 |
|
| People in Multi-Ethnic, Low-Income Areas |
7.71% |
2.10% |
367.37 |
|
| Unclassified |
0.00% |
0.06% |
0.00 |
|
|
 |
 |
 |
| £0-5K |
13.97% |
9.41% |
148.40 |
|
| £5-10K |
20.99% |
16.63% |
126.22 |
|
| £10-15K |
18.33% |
16.58% |
110.59 |
|
| £15-20K |
13.46% |
13.58% |
99.09 |
|
| £20-25K |
9.39% |
10.39% |
90.35 |
|
| £25-30K |
6.49% |
7.77% |
83.52 |
|
| £30-35K |
4.52% |
5.79% |
78.07 |
|
| £35-40K |
3.19% |
4.33% |
73.64 |
|
| £40-45K |
2.28% |
3.27% |
69.98 |
|
| £45-50K |
1.66% |
2.48% |
66.91 |
|
| £50-55K |
1.22% |
1.90% |
64.30 |
|
| £55-60K |
0.91% |
1.47% |
62.06 |
|
| £60-65K |
0.69% |
1.15% |
60.10 |
|
| £65-70K |
0.53% |
0.91% |
58.39 |
|
| £70-75K |
0.41% |
0.72% |
56.86 |
|
| £75-80K |
0.32% |
0.57% |
55.50 |
|
| £80-85K |
0.25% |
0.46% |
54.27 |
|
| £85-90K |
0.20% |
0.37% |
53.15 |
|
| £90-95K |
0.16% |
0.31% |
52.12 |
|
| £95-100K |
0.13% |
0.25% |
51.18 |
|
| £100K + |
0.63% |
1.34% |
46.53 |
|
|
|

|


|
1992-1997
|
1997-2001
|
|
|
|
| Con |
-10.19% |
| Lab |
9.67% |
| LD |
-2.06% |
|
| Con |
-1.21% |
| Lab |
1.08% |
| LD |
0.54% |
|
|
 |
Bruce George
Labour hold
|
| Con |
 |
10,643 |
30.50% |
| Lab |
 |
20,574 |
58.95% |
| LD |
 |
2,365 |
6.78% |
| Oth |
 |
1,317 |
3.77% |
| Maj |
 |
9,931 |
28.46% |
| Turn |
 |
34,899 |
55.70% |
|
|
 |
Bruce George
Labour hold
|
| UK |
Derek Bennett |
974 |
2.79% |
| C |
Mike Bird |
10,643 |
30.50% |
| L |
Bruce George |
20,574 |
58.95% |
| SA |
Peter Smith |
343 |
0.98% |
| LD |
Bill Tomlinson |
2,365 |
6.78% |
|
Candidates representing 5 parties stood for election to this seat.
|
|
 |
Bruce George
Labour
|
| Con |
 |
13,712 |
31.71% |
| Lab |
 |
25,024 |
57.87% |
| LD |
 |
2,698 |
6.24% |
| Ref |
 |
1,662 |
3.84% |
| Oth |
 |
144 |
0.33% |
| Maj |
 |
11,312 |
26.16% |
| Turn |
 |
43,240 |
67.33% |
|
|
 |
|
Labour
|
| Con |
 |
20,955 |
41.90% |
| Lab |
 |
24,133 |
48.20% |
| LD |
 |
4,132 |
8.30% |
| Oth |
 |
840 |
1.70% |
| Maj |
 |
3,178 |
6.30% |
| Turn |
 |
50,060 |
75.46% |
|
|
 |
|

|

