|
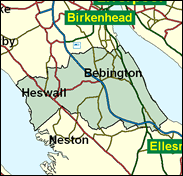
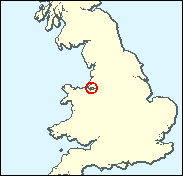
Wirral South
Labour hold

Like Wirral West, South counted as a gain in 1997, but it is a more likely seat for Labour to hold. After all, Ben Chapman had already taken the seat in a February 1997 by-election, so he is a two-time winner already. He is likely to make this three, unless the Conservative candidate Tony Millard can magic an eight pc swing, which would mean that his party would be ahead of Labour in the national standings, which has seemed a highly unlikely prospect for almost the whole of this Parliament.

Ben Chapman is a product of one of Labour's stupendous by-election victories, subsequently fallen like the rest into back bench obscurity, if in his case as PPS to Dick Caborn. His moment of triumph came in February 1997 within weeks of Labour's general election landslide. A pleasant-looking man, born 1940 and educated at Appleby Grammar School, he rose through the ranks of the civil service to become a commercial attachÈ in the diplomatic service. He was cynically picked as Labour candidate for his business-friendly image - a "Tory" candidate for a Tory seat, and seen by his Conservative opponent as "a blank piece of paper on which a script can be written". As a symbol of middle class disaffection with the Conservatives 1997-style his fate in 2001 will be instructive.
 |
| Wealthy Achievers, Suburban Areas |
30.42% |
14.99% |
202.87 |
|
| Affluent Greys, Rural Communities |
0.24% |
2.13% |
11.29 |
|
| Prosperous Pensioners, Retirement Areas |
1.47% |
2.49% |
58.95 |
|
| Affluent Executives, Family Areas |
6.31% |
4.43% |
142.59 |
|
| Well-Off Workers, Family Areas |
10.82% |
7.27% |
148.74 |
|
| Affluent Urbanites, Town & City Areas |
0.58% |
2.56% |
22.64 |
|
| Prosperous Professionals, Metropolitan Areas |
0.06% |
2.04% |
2.88 |
|
| Better-Off Executives, Inner City Areas |
0.34% |
3.94% |
8.60 |
|
| Comfortable Middle Agers, Mature Home Owning Areas |
21.20% |
13.04% |
162.55 |
|
| Skilled Workers, Home Owning Areas |
11.46% |
12.70% |
90.21 |
|
| New Home Owners, Mature Communities |
7.55% |
8.14% |
92.78 |
|
| White Collar Workers, Better-Off Multi Ethnic Areas |
0.59% |
4.02% |
14.76 |
|
| Older People, Less Prosperous Areas |
3.35% |
3.19% |
105.17 |
|
| Council Estate Residents, Better-Off Homes |
4.96% |
11.31% |
43.89 |
|
| Council Estate Residents, High Unemployment |
0.01% |
3.06% |
0.38 |
|
| Council Estate Residents, Greatest Hardship |
0.64% |
2.52% |
25.44 |
|
| People in Multi-Ethnic, Low-Income Areas |
0.00% |
2.10% |
0.00 |
|
| Unclassified |
0.00% |
0.06% |
0.00 |
|
|
 |
 |
 |
| £0-5K |
7.91% |
9.41% |
84.07 |
|
| £5-10K |
15.04% |
16.63% |
90.41 |
|
| £10-15K |
15.75% |
16.58% |
95.00 |
|
| £15-20K |
13.45% |
13.58% |
98.99 |
|
| £20-25K |
10.65% |
10.39% |
102.49 |
|
| £25-30K |
8.20% |
7.77% |
105.53 |
|
| £30-35K |
6.26% |
5.79% |
108.14 |
|
| £35-40K |
4.78% |
4.33% |
110.36 |
|
| £40-45K |
3.66% |
3.27% |
112.22 |
|
| £45-50K |
2.82% |
2.48% |
113.79 |
|
| £50-55K |
2.19% |
1.90% |
115.09 |
|
| £55-60K |
1.71% |
1.47% |
116.16 |
|
| £60-65K |
1.35% |
1.15% |
117.04 |
|
| £65-70K |
1.07% |
0.91% |
117.75 |
|
| £70-75K |
0.85% |
0.72% |
118.32 |
|
| £75-80K |
0.68% |
0.57% |
118.77 |
|
| £80-85K |
0.55% |
0.46% |
119.11 |
|
| £85-90K |
0.45% |
0.37% |
119.37 |
|
| £90-95K |
0.36% |
0.31% |
119.54 |
|
| £95-100K |
0.30% |
0.25% |
119.65 |
|
| £100K + |
1.59% |
1.34% |
118.54 |
|
|
|

|


|
1992-1997
|
1997-2001
|
|
|
|
| Con |
-14.42% |
| Lab |
16.34% |
| LD |
-2.67% |
|
| Con |
-1.62% |
| Lab |
-3.50% |
| LD |
7.36% |
|
|
 |
Ben Chapman
Labour hold
|
| Con |
 |
13,841 |
34.76% |
| Lab |
 |
18,890 |
47.44% |
| LD |
 |
7,087 |
17.80% |
| Oth |
|
0 |
0.00% |
| Maj |
 |
5,049 |
12.68% |
| Turn |
 |
39,818 |
65.65% |
|
|
 |
Ben Chapman
Labour hold
|
| L |
Ben Chapman |
18,890 |
47.44% |
| LD |
Phillip Gilchrist |
7,087 |
17.80% |
| C |
Anthony Millard |
13,841 |
34.76% |
|
Candidates representing 3 parties stood for election to this seat.
|
|
 |
Ben Chapman
Labour gain
|
| Con |
 |
17,495 |
36.38% |
| Lab |
 |
24,499 |
50.94% |
| LD |
 |
5,018 |
10.43% |
| Ref |
 |
768 |
1.60% |
| Oth |
 |
315 |
0.65% |
| Maj |
 |
7,004 |
14.56% |
| Turn |
 |
48,095 |
81.01% |
|
|
 |
|
Conservative
|
| Con |
 |
25,550 |
50.80% |
| Lab |
 |
17,382 |
34.60% |
| LD |
 |
6,572 |
13.10% |
| Oth |
 |
765 |
1.50% |
| Maj |
 |
8,168 |
16.20% |
| Turn |
 |
50,269 |
80.94% |
|
|
 |
|

|

