|
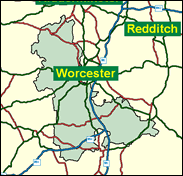
Worcestershire West
Conservative hold

In constituencies where there was clear tactical voting in 1997 Conservative seats were under demonstrably greater pressure than those where the Labour vote went up even when their cause was hopeless. In Worcestershire West the Liberal Democrat share went up by 8pc while that of the Labour candidate increased by less than 2pc, their 612th best performance. Although Michael Spicer polled a very respectable 45pc, he only won by 3,846. Next door, where the opposition was more evenly split in Worcestershire Mid, Peter Luff managed a lead of over 9,000 with a scarcely larger share. This seat is clearly not good ground for Labour, whatever local arrangements might have been made. The largest urban unit is Great Malvern with its spa and its Victorian ambience; nor are small towns like Pershore or the numerous villages within sight of either the Malverns or Bredon Hill any better. Yet perhaps that numerical Tory majority is not the best way of looking at it. The Labour vote has been squeezed already, and in order to win the Lib Dems will actually have to bite into Spicer's core, which might have reached its floor in the dismal year of 1997. He is therefore almost as safe as Luff next door, and reassuringly close to the security of a certain winning post at 50pc.

Sir Michael Spicer, first elected (for Worcestershire South) in 1974, and sometime protégé of Cecil Parkinson, rose and fell with his patron (as a minister from 1984 to 1990, and as a Party Vice Chairman 1981-84). He discarded his originally 'wet' credentials for free-market zealotry and dropped his earlier Europhila to become one of the leading Maastricht rebels, seeing the single currency as harbinger of a single state. He is a brigadier's son, born 1943 and educated at the soldiers' school, Wellington College, and at Emmanuel College, Cambridge. Dropped by Major in 1990, he backed Michael Howard in 1997, and in 1999 made John Prescott look very foolish by flooring him with a question on the proposed EU withholding tax, about which Prescott clearly knew little.
 |
| Wealthy Achievers, Suburban Areas |
46.96% |
14.99% |
313.18 |
|
| Affluent Greys, Rural Communities |
1.78% |
2.13% |
83.95 |
|
| Prosperous Pensioners, Retirement Areas |
6.39% |
2.49% |
257.02 |
|
| Affluent Executives, Family Areas |
1.83% |
4.43% |
41.30 |
|
| Well-Off Workers, Family Areas |
5.37% |
7.27% |
73.78 |
|
| Affluent Urbanites, Town & City Areas |
0.46% |
2.56% |
17.79 |
|
| Prosperous Professionals, Metropolitan Areas |
0.17% |
2.04% |
8.14 |
|
| Better-Off Executives, Inner City Areas |
0.09% |
3.94% |
2.39 |
|
| Comfortable Middle Agers, Mature Home Owning Areas |
21.76% |
13.04% |
166.90 |
|
| Skilled Workers, Home Owning Areas |
2.35% |
12.70% |
18.47 |
|
| New Home Owners, Mature Communities |
6.26% |
8.14% |
76.88 |
|
| White Collar Workers, Better-Off Multi Ethnic Areas |
0.53% |
4.02% |
13.16 |
|
| Older People, Less Prosperous Areas |
2.16% |
3.19% |
67.69 |
|
| Council Estate Residents, Better-Off Homes |
3.22% |
11.31% |
28.45 |
|
| Council Estate Residents, High Unemployment |
0.19% |
3.06% |
6.16 |
|
| Council Estate Residents, Greatest Hardship |
0.46% |
2.52% |
18.44 |
|
| People in Multi-Ethnic, Low-Income Areas |
0.00% |
2.10% |
0.00 |
|
| Unclassified |
0.03% |
0.06% |
52.95 |
|
|
 |
 |
 |
| £0-5K |
8.47% |
9.41% |
89.96 |
|
| £5-10K |
15.21% |
16.63% |
91.45 |
|
| £10-15K |
15.82% |
16.58% |
95.40 |
|
| £15-20K |
13.51% |
13.58% |
99.43 |
|
| £20-25K |
10.69% |
10.39% |
102.90 |
|
| £25-30K |
8.22% |
7.77% |
105.69 |
|
| £30-35K |
6.25% |
5.79% |
107.85 |
|
| £35-40K |
4.74% |
4.33% |
109.47 |
|
| £40-45K |
3.61% |
3.27% |
110.67 |
|
| £45-50K |
2.77% |
2.48% |
111.54 |
|
| £50-55K |
2.14% |
1.90% |
112.14 |
|
| £55-60K |
1.66% |
1.47% |
112.55 |
|
| £60-65K |
1.30% |
1.15% |
112.80 |
|
| £65-70K |
1.02% |
0.91% |
112.94 |
|
| £70-75K |
0.81% |
0.72% |
112.99 |
|
| £75-80K |
0.65% |
0.57% |
112.99 |
|
| £80-85K |
0.52% |
0.46% |
112.93 |
|
| £85-90K |
0.42% |
0.37% |
112.84 |
|
| £90-95K |
0.34% |
0.31% |
112.73 |
|
| £95-100K |
0.28% |
0.25% |
112.61 |
|
| £100K + |
1.50% |
1.34% |
111.90 |
|
|
|

|


|
1992-1997
|
1997-2001
|
|
|
|
| Con |
-9.66% |
| Lab |
1.88% |
| LD |
7.94% |
|
| Con |
0.93% |
| Lab |
-1.68% |
| LD |
-3.27% |
|
|
 |
Michael Spicer
Conservative hold
|
| Con |
 |
20,597 |
45.97% |
| Lab |
 |
6,275 |
14.00% |
| LD |
 |
15,223 |
33.97% |
| Oth |
 |
2,712 |
6.05% |
| Maj |
 |
5,374 |
11.99% |
| Turn |
 |
44,807 |
67.11% |
|
|
 |
Michael Spicer
Conservative hold
|
| L |
Waquar Azmi |
6,275 |
14.00% |
| LD |
Mike Hadley |
15,223 |
33.97% |
| UK |
Ian Morris |
1,574 |
3.51% |
| C |
Michael Spicer |
20,597 |
45.97% |
| G |
Malcolm Victory |
1,138 |
2.54% |
|
Candidates representing 5 parties stood for election to this seat.
|
|
 |
Michael Spicer
Conservative
|
| Con |
 |
22,223 |
45.04% |
| Lab |
 |
7,738 |
15.68% |
| LD |
 |
18,377 |
37.24% |
| Ref |
|
0 |
0.00% |
| Oth |
 |
1,006 |
2.04% |
| Maj |
 |
3,846 |
7.79% |
| Turn |
 |
49,344 |
76.25% |
|
|
 |
|
Conservative
|
| Con |
 |
27,654 |
54.70% |
| Lab |
 |
6,967 |
13.80% |
| LD |
 |
14,785 |
29.30% |
| Oth |
 |
1,104 |
2.20% |
| Maj |
 |
12,869 |
25.50% |
| Turn |
 |
50,510 |
79.99% |
|
|
 |
|

|

