|
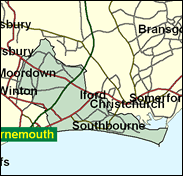
Bournemouth East
Conservative hold

Whereas other south coast resort towns have seen tight contests, unexpected results, and changes of hand between parties in recent elections, especially that of 1997, Bournemouth has remained resolutely Conservative, and neither the East nor West constituencies
have drawn attention within living memory, at least not because of electoral alarums; two MPs in the East division have departed under unusual circumstances, Nigel Nicolson in the 1950s because of his principled opposition to the Suez adventure and John Cordle in the 1970s through involvement in the Poulson corruption scandal. Few waves disturb the calm surface now. The Liberal Democrats do better in this seat, winning 14 seats in the 1999 council elections to the Tories' 11, for example, but it is far from the top of their target list in a General Election.

David Atkinson, MP here since 1977, is of the Conservative Party's garagiste tendency, having been a car dealer. With an interest in complementary medicine - in his case chiropractice, and computers (as Matthew Parris has put it "every Parliament needs a techno-nerd"), he was born in 1940, attended St George's (RC) College, Weybridge and at technical colleges, and takes a Catholic line on embryo research, and a deviant non-Tory line against hunting. He also favours resettlement of displaced Palestinians.

 |
| Wealthy Achievers, Suburban Areas |
26.75% |
14.99% |
178.41 |
|
| Affluent Greys, Rural Communities |
0.19% |
2.13% |
8.90 |
|
| Prosperous Pensioners, Retirement Areas |
13.24% |
2.49% |
532.54 |
|
| Affluent Executives, Family Areas |
1.83% |
4.43% |
41.44 |
|
| Well-Off Workers, Family Areas |
6.37% |
7.27% |
87.59 |
|
| Affluent Urbanites, Town & City Areas |
4.29% |
2.56% |
167.32 |
|
| Prosperous Professionals, Metropolitan Areas |
0.00% |
2.04% |
0.00 |
|
| Better-Off Executives, Inner City Areas |
13.21% |
3.94% |
334.85 |
|
| Comfortable Middle Agers, Mature Home Owning Areas |
20.14% |
13.04% |
154.45 |
|
| Skilled Workers, Home Owning Areas |
3.71% |
12.70% |
29.23 |
|
| New Home Owners, Mature Communities |
3.59% |
8.14% |
44.14 |
|
| White Collar Workers, Better-Off Multi Ethnic Areas |
2.93% |
4.02% |
72.87 |
|
| Older People, Less Prosperous Areas |
0.84% |
3.19% |
26.43 |
|
| Council Estate Residents, Better-Off Homes |
2.37% |
11.31% |
20.94 |
|
| Council Estate Residents, High Unemployment |
0.53% |
3.06% |
17.34 |
|
| Council Estate Residents, Greatest Hardship |
0.00% |
2.52% |
0.00 |
|
| People in Multi-Ethnic, Low-Income Areas |
0.00% |
2.10% |
0.00 |
|
| Unclassified |
0.00% |
0.06% |
0.00 |
|
|
 |
 |
 |
| £0-5K |
9.05% |
9.41% |
96.12 |
|
| £5-10K |
17.24% |
16.63% |
103.64 |
|
| £10-15K |
17.74% |
16.58% |
107.01 |
|
| £15-20K |
14.57% |
13.58% |
107.27 |
|
| £20-25K |
10.98% |
10.39% |
105.62 |
|
| £25-30K |
8.00% |
7.77% |
102.90 |
|
| £30-35K |
5.77% |
5.79% |
99.67 |
|
| £35-40K |
4.17% |
4.33% |
96.27 |
|
| £40-45K |
3.03% |
3.27% |
92.87 |
|
| £45-50K |
2.22% |
2.48% |
89.58 |
|
| £50-55K |
1.65% |
1.90% |
86.47 |
|
| £55-60K |
1.23% |
1.47% |
83.54 |
|
| £60-65K |
0.93% |
1.15% |
80.80 |
|
| £65-70K |
0.71% |
0.91% |
78.25 |
|
| £70-75K |
0.55% |
0.72% |
75.88 |
|
| £75-80K |
0.42% |
0.57% |
73.66 |
|
| £80-85K |
0.33% |
0.46% |
71.60 |
|
| £85-90K |
0.26% |
0.37% |
69.68 |
|
| £90-95K |
0.21% |
0.31% |
67.88 |
|
| £95-100K |
0.17% |
0.25% |
66.20 |
|
| £100K + |
0.77% |
1.34% |
57.53 |
|
|
|

|


|
1992-1997
|
1997-2001
|
|
|
|
| Con |
-14.06% |
| Lab |
8.34% |
| LD |
0.33% |
|
| Con |
1.86% |
| Lab |
-1.29% |
| LD |
2.27% |
|
|
 |
David Atkinson
Conservative hold
|
| Con |
 |
15,501 |
43.30% |
| Lab |
 |
7,107 |
19.85% |
| LD |
 |
12,067 |
33.71% |
| Oth |
 |
1,124 |
3.14% |
| Maj |
 |
3,434 |
9.59% |
| Turn |
 |
35,799 |
59.22% |
|
|
 |
David Atkinson
Conservative hold
|
| C |
David Atkinson |
15,501 |
43.30% |
| UK |
George Chamberlaine |
1,124 |
3.14% |
| LD |
Andrew Garratt |
12,067 |
33.71% |
| L |
Paul Nicholson |
7,107 |
19.85% |
|
Candidates representing 4 parties stood for election to this seat.
|
|
 |
David Atkinson
Conservative
|
| Con |
 |
17,997 |
41.44% |
| Lab |
 |
9,181 |
21.14% |
| LD |
 |
13,651 |
31.43% |
| Ref |
 |
1,808 |
4.16% |
| Oth |
 |
791 |
1.82% |
| Maj |
 |
4,346 |
10.01% |
| Turn |
 |
43,428 |
70.20% |
|
|
 |
|
Conservative
|
| Con |
 |
25,558 |
55.50% |
| Lab |
 |
5,916 |
12.80% |
| LD |
 |
14,315 |
31.10% |
| Oth |
 |
277 |
0.60% |
| Maj |
 |
11,243 |
24.40% |
| Turn |
 |
46,066 |
72.66% |
|
|
 |
|

|

