|
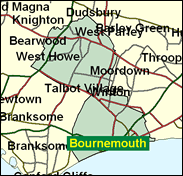
Bournemouth West
Conservative hold

West is slightly more working class than the other Bournemouth seat
, including as it does the two wards Labour can win on the local unitary authorty, Kinson and Wallisdown. There are council housing estates here, which can scarcely be said of East. Yet the effect is that while the Labour vote is higher than in its neighbour, it is the Liberal Democrat share which is lower, not the Conservative percentage. This means that actually John Butterfill has a somewhat higher majority and safer seat than David Atkinson of East, especially as the race for second place is close enough to discourage tactical voting. The overall tone of Conservatism in Bournemouth will prevail. There is little of the bohemian aspect of Brighton here, or the economic problems of Hastings or Torquay or the Isle of Thanet. The town is reinventing itself as a prosperous and forward looking site for corporate headquarters and as a conference centre - as far as the autumn political conferences go, Blackpool's loss has been Bournemouth's gain.

John Butterfill, a pudgy-faced chartered surveyor, born in 1941 and educated at Caterham and a college of estate management, was elected here in 1983 having lost Croydon NW to the Liberals two years earlier. He is a Europhile whose attempt to align the UK with Continental double-summer time predictably had the Caledonians raving about having to get up in the dark.

 |
| Wealthy Achievers, Suburban Areas |
13.12% |
14.99% |
87.53 |
|
| Affluent Greys, Rural Communities |
2.77% |
2.13% |
130.31 |
|
| Prosperous Pensioners, Retirement Areas |
24.87% |
2.49% |
1,000.20 |
|
| Affluent Executives, Family Areas |
0.71% |
4.43% |
15.96 |
|
| Well-Off Workers, Family Areas |
0.71% |
7.27% |
9.76 |
|
| Affluent Urbanites, Town & City Areas |
7.92% |
2.56% |
308.92 |
|
| Prosperous Professionals, Metropolitan Areas |
0.23% |
2.04% |
11.04 |
|
| Better-Off Executives, Inner City Areas |
12.60% |
3.94% |
319.52 |
|
| Comfortable Middle Agers, Mature Home Owning Areas |
12.81% |
13.04% |
98.27 |
|
| Skilled Workers, Home Owning Areas |
1.82% |
12.70% |
14.37 |
|
| New Home Owners, Mature Communities |
9.09% |
8.14% |
111.60 |
|
| White Collar Workers, Better-Off Multi Ethnic Areas |
3.64% |
4.02% |
90.54 |
|
| Older People, Less Prosperous Areas |
2.80% |
3.19% |
87.81 |
|
| Council Estate Residents, Better-Off Homes |
5.90% |
11.31% |
52.13 |
|
| Council Estate Residents, High Unemployment |
0.63% |
3.06% |
20.48 |
|
| Council Estate Residents, Greatest Hardship |
0.38% |
2.52% |
15.00 |
|
| People in Multi-Ethnic, Low-Income Areas |
0.00% |
2.10% |
0.00 |
|
| Unclassified |
0.01% |
0.06% |
13.46 |
|
|
 |
|
|
| £0-5K |
10.95% |
9.41% |
116.34 |
|
| £5-10K |
18.74% |
16.63% |
112.66 |
|
| £10-15K |
17.96% |
16.58% |
108.31 |
|
| £15-20K |
14.07% |
13.58% |
103.59 |
|
| £20-25K |
10.29% |
10.39% |
99.01 |
|
| £25-30K |
7.37% |
7.77% |
94.79 |
|
| £30-35K |
5.27% |
5.79% |
90.97 |
|
| £35-40K |
3.79% |
4.33% |
87.54 |
|
| £40-45K |
2.76% |
3.27% |
84.47 |
|
| £45-50K |
2.03% |
2.48% |
81.70 |
|
| £50-55K |
1.51% |
1.90% |
79.19 |
|
| £55-60K |
1.13% |
1.47% |
76.91 |
|
| £60-65K |
0.86% |
1.15% |
74.83 |
|
| £65-70K |
0.66% |
0.91% |
72.92 |
|
| £70-75K |
0.51% |
0.72% |
71.16 |
|
| £75-80K |
0.40% |
0.57% |
69.53 |
|
| £80-85K |
0.31% |
0.46% |
68.01 |
|
| £85-90K |
0.25% |
0.37% |
66.59 |
|
| £90-95K |
0.20% |
0.31% |
65.27 |
|
| £95-100K |
0.16% |
0.25% |
64.02 |
|
| £100K + |
0.77% |
1.34% |
57.48 |
|
|
|
|


|
1992-1997
|
1997-2001
|
|
|
|
| Con |
-10.83% |
| Lab |
5.07% |
| LD |
0.37% |
|
| Con |
-7.57% |
| Lab |
-1.64% |
| LD |
-4.83% |
|
|
|
John Butterfill
Conservative hold
|
| Con |
 |
14,417 |
34.10% |
| Lab |
 |
9,699 |
22.94% |
| LD |
 |
9,699 |
22.94% |
| Oth |
 |
8,468 |
20.03% |
| Maj |
 |
4,718 |
11.16% |
| Turn |
|
42,283 |
68.16% |
|
|
|
John Butterfill
Conservative hold
|
| UK |
Cynthia Blake |
8,468 |
20.03% |
| C |
John Butterfill |
14,417 |
34.10% |
| LD |
Fiona Hornby |
9,699 |
22.94% |
| L |
David Stokes |
9,699 |
22.94% |
|
Candidates representing 4 parties stood for election to this seat.
|
|
|
John Buttefill
Conservative
|
| Con |
|
17,115 |
41.67% |
| Lab |
|
10,093 |
24.57% |
| LD |
|
11,405 |
27.77% |
| Ref |
 |
1,910 |
4.65% |
| Oth |
|
549 |
1.34% |
| Maj |
|
5,710 |
13.90% |
| Turn |
|
41,072 |
66.22% |
|
|
|
|
Conservative
|
| Con |
|
24,532 |
52.50% |
| Lab |
|
9,110 |
19.50% |
| LD |
|
12,815 |
27.40% |
| Oth |
|
257 |
0.60% |
| Maj |
|
11,717 |
25.10% |
| Turn |
|
46,714 |
73.89% |
|
|
|
|
|