|
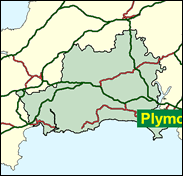
Cornwall South East
Liberal Democrat hold

The Conservatives' one strong issue in Cornwall would seem to be Europe, judging from their very strong showing in the European elections here in June 1999, when they outpolled the Liberal Democrats by 7pc within the South East Cornwall seat. But before the relatively less known Colin Breed is written off, it should be noted that the Conservatives were as far or even further ahead in seats like Truro and North Cornwall, which are generally regarded as rock-solid. The single issue Euro contests, with their very low turnout, are probably are very poor predictor of the next General Election, and Breed should be regarded as the favourite against the Conservatives' Ashley Gray, even if his fairly comfortable 6,500 majority may be dented.

Bearded Colin Breed, an uncharismatic self-employed small businessman, and Lib Dem Agriculture spokesman, won this seat in 1997. Born in London in 1947, educated at Torquay Grammar School, he was a Midland Bank employee for 17 years before setting up on his own in finance and regional distribution businesses. A Methodist lay preacher who votes conservatively on guns, hunting and homosexuality, he represents a seat held between the wars (as ‘Bodmin’) by Isaac Foot, father of Michael, for the Liberals. Otherwise, foot and mouth has also put him on the map.
 |
| Wealthy Achievers, Suburban Areas |
10.43% |
14.99% |
69.53 |
|
| Affluent Greys, Rural Communities |
18.97% |
2.13% |
892.40 |
|
| Prosperous Pensioners, Retirement Areas |
2.29% |
2.49% |
92.24 |
|
| Affluent Executives, Family Areas |
1.81% |
4.43% |
40.88 |
|
| Well-Off Workers, Family Areas |
8.74% |
7.27% |
120.22 |
|
| Affluent Urbanites, Town & City Areas |
0.01% |
2.56% |
0.54 |
|
| Prosperous Professionals, Metropolitan Areas |
0.00% |
2.04% |
0.00 |
|
| Better-Off Executives, Inner City Areas |
0.10% |
3.94% |
2.54 |
|
| Comfortable Middle Agers, Mature Home Owning Areas |
28.01% |
13.04% |
214.81 |
|
| Skilled Workers, Home Owning Areas |
7.48% |
12.70% |
58.89 |
|
| New Home Owners, Mature Communities |
11.92% |
8.14% |
146.35 |
|
| White Collar Workers, Better-Off Multi Ethnic Areas |
3.82% |
4.02% |
94.90 |
|
| Older People, Less Prosperous Areas |
1.68% |
3.19% |
52.58 |
|
| Council Estate Residents, Better-Off Homes |
4.23% |
11.31% |
37.37 |
|
| Council Estate Residents, High Unemployment |
0.01% |
3.06% |
0.39 |
|
| Council Estate Residents, Greatest Hardship |
0.50% |
2.52% |
19.94 |
|
| People in Multi-Ethnic, Low-Income Areas |
0.00% |
2.10% |
0.00 |
|
| Unclassified |
0.00% |
0.06% |
0.00 |
|
|
 |
 |
 |
| £0-5K |
10.46% |
9.41% |
111.17 |
|
| £5-10K |
19.64% |
16.63% |
118.09 |
|
| £10-15K |
19.30% |
16.58% |
116.39 |
|
| £15-20K |
15.03% |
13.58% |
110.69 |
|
| £20-25K |
10.73% |
10.39% |
103.22 |
|
| £25-30K |
7.41% |
7.77% |
95.30 |
|
| £30-35K |
5.07% |
5.79% |
87.62 |
|
| £35-40K |
3.49% |
4.33% |
80.47 |
|
| £40-45K |
2.42% |
3.27% |
73.98 |
|
| £45-50K |
1.69% |
2.48% |
68.14 |
|
| £50-55K |
1.20% |
1.90% |
62.93 |
|
| £55-60K |
0.86% |
1.47% |
58.28 |
|
| £60-65K |
0.62% |
1.15% |
54.14 |
|
| £65-70K |
0.46% |
0.91% |
50.44 |
|
| £70-75K |
0.34% |
0.72% |
47.14 |
|
| £75-80K |
0.25% |
0.57% |
44.18 |
|
| £80-85K |
0.19% |
0.46% |
41.52 |
|
| £85-90K |
0.15% |
0.37% |
39.12 |
|
| £90-95K |
0.11% |
0.31% |
36.95 |
|
| £95-100K |
0.09% |
0.25% |
34.99 |
|
| £100K + |
0.35% |
1.34% |
26.41 |
|
|
|

|


|
1992-1997
|
1997-2001
|
|
|
|
| Con |
-15.19% |
| Lab |
3.61% |
| LD |
8.99% |
|
| Con |
-0.29% |
| Lab |
-0.39% |
| LD |
-1.19% |
|
|
 |
Colin Breed
Liberal Democrat hold
|
| Con |
 |
18,381 |
35.52% |
| Lab |
 |
6,429 |
12.42% |
| LD |
 |
23,756 |
45.90% |
| Oth |
 |
3,187 |
6.16% |
| Maj |
 |
5,375 |
10.39% |
| Turn |
 |
51,753 |
65.44% |
|
|
 |
Colin Breed
Liberal Democrat hold
|
| LD |
Colin Breed |
23,756 |
45.90% |
| MK |
Ken George |
1,209 |
2.34% |
| L |
Ashley Gray |
6,429 |
12.42% |
| UK |
Graham Palmer |
1,978 |
3.82% |
| C |
Bill Stevens |
18,381 |
35.52% |
|
Candidates representing 5 parties stood for election to this seat.
|
|
 |
Colin Breed
Liberal Democrat gain
|
| Con |
 |
20,564 |
35.81% |
| Lab |
 |
7,358 |
12.81% |
| LD |
 |
27,044 |
47.09% |
| Ref |
|
0 |
0.00% |
| Oth |
 |
2,466 |
4.29% |
| Maj |
 |
6,480 |
11.28% |
| Turn |
 |
57,432 |
75.74% |
|
|
 |
|
Conservative
|
| Con |
 |
30,565 |
51.00% |
| Lab |
 |
5,536 |
9.20% |
| LD |
 |
22,861 |
38.10% |
| Oth |
 |
1,026 |
1.70% |
| Maj |
 |
7,704 |
12.80% |
| Turn |
 |
59,988 |
81.14% |
|
|
 |
|

|

