|
Harrow West
Labour hold

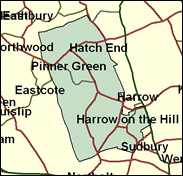
Statistically the most unlikely of all Labour gains in the landslide of 1997, the Conservatives' former research chief Danny Finkelstein is bound to regain Pinner and Hatch End and Harrow on the Hill - or is he? It remains possible that Labour will actually do as well as 1997 at the next General Election, although few expect it, or even to increase their already massive overall majority. The Tories one strong card, Europe, does not seem to play particularly well in this borough: in June 1999 Labour did better in Harrow West than in seats like Croydon Central or Wimbledon or any of the three in Havering Borough, this coming on top of the even worse news that Labour candidates actually won more votes than the Conservatives in the seat in the local elections of 1998. Another huge shock could just be on the way.

Gareth Thomas, who was the least-expected Labour victor in 1997, is a local born (1967) and educated (Hatch End High School, then Aberystwyth University) school teacher and councillor, whose loyalty was rewarded by being made PPS to Charles Clarke (Home Office) in 1999. His likely Tory nemesis takes the shape of Danny Finkelstein, who is proof that not all SDPers moved into the Liberal Democrats - or back to Labour, but - like John Horam (ex-Labour, then SDP, now Conservative MP) - moved to the right. He joined the Tories in 1991 after having worked closely with David Owen in, and after the winding-up of, the SDP. Born 1962 and educated at University College School and LSE, he ran the right wing Social Market Foundation 1992-95, and the Conservative Research Department 1995-99 (where he drafted the European election campaign manifesto 'In Europe, not run by Europe'), and as such was a speech writer and adviser to PM John Major 1995-97, acquiring a gong in Major's resignation honours. He would seem a certainty for the Tory front bench after the election.
 |
| Wealthy Achievers, Suburban Areas |
33.14% |
14.99% |
221.06 |
|
| Affluent Greys, Rural Communities |
0.00% |
2.13% |
0.00 |
|
| Prosperous Pensioners, Retirement Areas |
2.40% |
2.49% |
96.43 |
|
| Affluent Executives, Family Areas |
0.00% |
4.43% |
0.00 |
|
| Well-Off Workers, Family Areas |
0.27% |
7.27% |
3.74 |
|
| Affluent Urbanites, Town & City Areas |
6.12% |
2.56% |
238.52 |
|
| Prosperous Professionals, Metropolitan Areas |
11.18% |
2.04% |
547.93 |
|
| Better-Off Executives, Inner City Areas |
0.88% |
3.94% |
22.41 |
|
| Comfortable Middle Agers, Mature Home Owning Areas |
4.26% |
13.04% |
32.66 |
|
| Skilled Workers, Home Owning Areas |
0.88% |
12.70% |
6.92 |
|
| New Home Owners, Mature Communities |
1.61% |
8.14% |
19.75 |
|
| White Collar Workers, Better-Off Multi Ethnic Areas |
33.11% |
4.02% |
823.40 |
|
| Older People, Less Prosperous Areas |
0.85% |
3.19% |
26.61 |
|
| Council Estate Residents, Better-Off Homes |
1.13% |
11.31% |
10.02 |
|
| Council Estate Residents, High Unemployment |
3.70% |
3.06% |
120.67 |
|
| Council Estate Residents, Greatest Hardship |
0.02% |
2.52% |
0.73 |
|
| People in Multi-Ethnic, Low-Income Areas |
0.45% |
2.10% |
21.34 |
|
| Unclassified |
0.00% |
0.06% |
0.00 |
|
|
 |
|
|
| £0-5K |
3.95% |
9.41% |
41.99 |
|
| £5-10K |
8.78% |
16.63% |
52.78 |
|
| £10-15K |
11.28% |
16.58% |
68.03 |
|
| £15-20K |
11.51% |
13.58% |
84.70 |
|
| £20-25K |
10.55% |
10.39% |
101.51 |
|
| £25-30K |
9.16% |
7.77% |
117.82 |
|
| £30-35K |
7.72% |
5.79% |
133.31 |
|
| £35-40K |
6.41% |
4.33% |
147.85 |
|
| £40-45K |
5.27% |
3.27% |
161.38 |
|
| £45-50K |
4.32% |
2.48% |
173.93 |
|
| £50-55K |
3.53% |
1.90% |
185.56 |
|
| £55-60K |
2.89% |
1.47% |
196.31 |
|
| £60-65K |
2.37% |
1.15% |
206.27 |
|
| £65-70K |
1.95% |
0.91% |
215.49 |
|
| £70-75K |
1.61% |
0.72% |
224.04 |
|
| £75-80K |
1.33% |
0.57% |
231.98 |
|
| £80-85K |
1.11% |
0.46% |
239.37 |
|
| £85-90K |
0.92% |
0.37% |
246.25 |
|
| £90-95K |
0.77% |
0.31% |
252.67 |
|
| £95-100K |
0.65% |
0.25% |
258.67 |
|
| £100K + |
3.87% |
1.34% |
288.18 |
|
|
|
|


|
1992-1997
|
1997-2001
|
|
|
|
| Con |
-16.02% |
| Lab |
19.04% |
| LD |
-4.72% |
|
| Con |
-2.77% |
| Lab |
8.07% |
| LD |
-2.63% |
|
|
|
Gareth Thomas
Labour hold
|
| Con |
 |
16,986 |
36.41% |
| Lab |
 |
23,142 |
49.61% |
| LD |
 |
5,995 |
12.85% |
| Oth |
 |
525 |
1.13% |
| Maj |
 |
6,156 |
13.20% |
| Turn |
|
46,648 |
63.46% |
|
|
|
Gareth Thomas
Labour hold
|
| C |
Danny Finkelstein |
16,986 |
36.41% |
| UK |
Peter Kefford |
525 |
1.13% |
| LD |
Christopher Noyce |
5,995 |
12.85% |
| L |
Gareth Thomas |
23,142 |
49.61% |
|
Candidates representing 4 parties stood for election to this seat.
|
|
|
Gareth Thomas
Labour gain
|
| Con |
|
20,571 |
39.18% |
| Lab |
|
21,811 |
41.54% |
| LD |
|
8,127 |
15.48% |
| Ref |
 |
1,997 |
3.80% |
| Oth |
|
0 |
0.00% |
| Maj |
|
1,240 |
2.36% |
| Turn |
|
52,506 |
72.92% |
|
|
|
|
Conservative
|
| Con |
|
30,227 |
55.20% |
| Lab |
|
12,337 |
22.50% |
| LD |
|
11,045 |
20.20% |
| Oth |
|
1,151 |
2.10% |
| Maj |
|
17,890 |
32.70% |
| Turn |
|
54,760 |
77.37% |
|
|
|
|
|