|
Norfolk South
Conservative hold

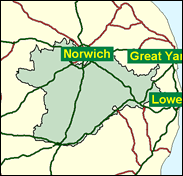
The only Tory seat of the four they still hold in Norfolk which looks at all safe is South, but that is something of an illusion. The 40pc share that John MacGregor achieved here was not as high as that in Norfolk South West, nor even as high as that in Norfolk North West, where they actually lost to Labour, and the 7,378 majority only appears comfortable because of the very even division of over 54pc of the total vote between the Liberal Democrats and Labour. The Liberal Democrats control the local council; Labour did very well nationally and increased their share by 8pc in 1997. If some kind of arrangement could be sorted out down here in Diss and Wymondham and Harleston and Loddon and the villages extending to the Suffolk border, the successor to the small Scottish conjuror might look as if he is in trouble.

Richard Bacon has replaced the retiring John MacGregor for the Conservatives here. Formerly a merchant banker with Barclays de Zoete Wedd, and a financial journalist with Euromoney Publications, he is now a partner in the Brunswick Group, a financial communications consultancy. He lists himself as hostile to devolution and proportional representation, and in favour of "retaining control of tax and spending in the UK", and of setting by ability in schools. Born 1962 and educated at King's School, Worcester and the LSE, he fought Vauxhall in 1997, and campaigned against devolved London government.
 |
| Wealthy Achievers, Suburban Areas |
33.55% |
14.99% |
223.76 |
|
| Affluent Greys, Rural Communities |
4.24% |
2.13% |
199.52 |
|
| Prosperous Pensioners, Retirement Areas |
4.02% |
2.49% |
161.56 |
|
| Affluent Executives, Family Areas |
5.81% |
4.43% |
131.39 |
|
| Well-Off Workers, Family Areas |
5.33% |
7.27% |
73.29 |
|
| Affluent Urbanites, Town & City Areas |
0.42% |
2.56% |
16.44 |
|
| Prosperous Professionals, Metropolitan Areas |
0.00% |
2.04% |
0.00 |
|
| Better-Off Executives, Inner City Areas |
0.00% |
3.94% |
0.00 |
|
| Comfortable Middle Agers, Mature Home Owning Areas |
34.15% |
13.04% |
261.88 |
|
| Skilled Workers, Home Owning Areas |
2.58% |
12.70% |
20.35 |
|
| New Home Owners, Mature Communities |
7.00% |
8.14% |
86.00 |
|
| White Collar Workers, Better-Off Multi Ethnic Areas |
0.15% |
4.02% |
3.66 |
|
| Older People, Less Prosperous Areas |
1.44% |
3.19% |
45.33 |
|
| Council Estate Residents, Better-Off Homes |
1.30% |
11.31% |
11.49 |
|
| Council Estate Residents, High Unemployment |
0.00% |
3.06% |
0.00 |
|
| Council Estate Residents, Greatest Hardship |
0.00% |
2.52% |
0.00 |
|
| People in Multi-Ethnic, Low-Income Areas |
0.00% |
2.10% |
0.00 |
|
| Unclassified |
0.00% |
0.06% |
0.00 |
|
|
 |
 |
 |
| £0-5K |
8.58% |
9.41% |
91.11 |
|
| £5-10K |
16.63% |
16.63% |
99.96 |
|
| £10-15K |
17.35% |
16.58% |
104.63 |
|
| £15-20K |
14.46% |
13.58% |
106.43 |
|
| £20-25K |
11.04% |
10.39% |
106.26 |
|
| £25-30K |
8.15% |
7.77% |
104.83 |
|
| £30-35K |
5.95% |
5.79% |
102.65 |
|
| £35-40K |
4.33% |
4.33% |
100.03 |
|
| £40-45K |
3.17% |
3.27% |
97.20 |
|
| £45-50K |
2.34% |
2.48% |
94.28 |
|
| £50-55K |
1.74% |
1.90% |
91.38 |
|
| £55-60K |
1.31% |
1.47% |
88.53 |
|
| £60-65K |
0.99% |
1.15% |
85.79 |
|
| £65-70K |
0.75% |
0.91% |
83.15 |
|
| £70-75K |
0.58% |
0.72% |
80.64 |
|
| £75-80K |
0.45% |
0.57% |
78.26 |
|
| £80-85K |
0.35% |
0.46% |
76.00 |
|
| £85-90K |
0.28% |
0.37% |
73.85 |
|
| £90-95K |
0.22% |
0.31% |
71.82 |
|
| £95-100K |
0.17% |
0.25% |
69.90 |
|
| £100K + |
0.80% |
1.34% |
59.86 |
|
|
|

|


|
1992-1997
|
1997-2001
|
|
|
|
| Con |
-12.25% |
| Lab |
7.67% |
| LD |
1.37% |
|
| Con |
2.02% |
| Lab |
-1.54% |
| LD |
1.58% |
|
|
 |
Richard Bacon
Conservative hold
|
| Con |
 |
23,589 |
42.18% |
| Lab |
 |
13,719 |
24.53% |
| LD |
 |
16,696 |
29.85% |
| Oth |
 |
1,925 |
3.44% |
| Maj |
 |
6,893 |
12.32% |
| Turn |
 |
55,929 |
67.62% |
|
|
 |
Richard Bacon
Conservative hold
|
| C |
Richard Bacon |
23,589 |
42.18% |
| LD |
Anne Lee |
16,696 |
29.85% |
| UK |
Joseph Neal |
856 |
1.53% |
| G |
Stephanie Ross-Wagenknecht |
1,069 |
1.91% |
| L |
Mark Wells |
13,719 |
24.53% |
|
Candidates representing 5 parties stood for election to this seat.
|
|
 |
John MacGregor
Conservative
|
| Con |
 |
24,935 |
40.15% |
| Lab |
 |
16,188 |
26.07% |
| LD |
 |
17,557 |
28.27% |
| Ref |
 |
2,533 |
4.08% |
| Oth |
 |
884 |
1.42% |
| Maj |
 |
7,378 |
11.88% |
| Turn |
 |
62,097 |
78.37% |
|
|
 |
|
Conservative
|
| Con |
 |
33,669 |
52.40% |
| Lab |
 |
11,841 |
18.40% |
| LD |
 |
17,305 |
26.90% |
| Oth |
 |
1,495 |
2.30% |
| Maj |
 |
16,364 |
25.40% |
| Turn |
 |
64,310 |
84.07% |
|
|
 |
|

|

