|
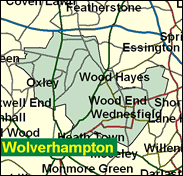
Wolverhampton North East
Conservative gain

Another in the belt of Black Country seats with a very working class and council housing profile yet a far from unblemished record of Labour success (see Walsall North, West Bromwich East) North East is a two-party contest (the Liberal Democrats are very weak) which the Conservatives actually won in 1987, and which would still look close if the 12pc swing recorded in 1997 were to be erased. But it cannot be, and it probably won't be reversed either, not in 2001 at any rate.

Ken Purchase, elected in 1992, continues being PPS to Robin Cook with regular visits to Bahrain on whose behalf he proselytises despite its questionable record on human rights. A toolmaker-turned-adviser to worker-controlled co-operatives, he was in 1939 and attended a local secondary modern school and Wolverhampton Polytechnic. In 1994 he voted for Beckett not Blair, and in 1999, unusually for a PPS, he claimed DTI Secretaries, Mandelson and Byers had pressed Robin Cook to agree to supplying Hawk jests to Indonesia.
 |
| Wealthy Achievers, Suburban Areas |
0.11% |
14.99% |
0.73 |
|
| Affluent Greys, Rural Communities |
0.00% |
2.13% |
0.00 |
|
| Prosperous Pensioners, Retirement Areas |
0.00% |
2.49% |
0.00 |
|
| Affluent Executives, Family Areas |
2.57% |
4.43% |
58.02 |
|
| Well-Off Workers, Family Areas |
8.63% |
7.27% |
118.66 |
|
| Affluent Urbanites, Town & City Areas |
0.00% |
2.56% |
0.00 |
|
| Prosperous Professionals, Metropolitan Areas |
0.00% |
2.04% |
0.00 |
|
| Better-Off Executives, Inner City Areas |
1.61% |
3.94% |
40.75 |
|
| Comfortable Middle Agers, Mature Home Owning Areas |
2.65% |
13.04% |
20.31 |
|
| Skilled Workers, Home Owning Areas |
23.41% |
12.70% |
184.31 |
|
| New Home Owners, Mature Communities |
17.03% |
8.14% |
209.19 |
|
| White Collar Workers, Better-Off Multi Ethnic Areas |
0.00% |
4.02% |
0.00 |
|
| Older People, Less Prosperous Areas |
5.89% |
3.19% |
185.03 |
|
| Council Estate Residents, Better-Off Homes |
19.63% |
11.31% |
173.55 |
|
| Council Estate Residents, High Unemployment |
3.86% |
3.06% |
125.98 |
|
| Council Estate Residents, Greatest Hardship |
13.61% |
2.52% |
540.33 |
|
| People in Multi-Ethnic, Low-Income Areas |
1.00% |
2.10% |
47.66 |
|
| Unclassified |
0.00% |
0.06% |
0.00 |
|
|
 |
 |
 |
| £0-5K |
15.37% |
9.41% |
163.33 |
|
| £5-10K |
23.36% |
16.63% |
140.45 |
|
| £10-15K |
19.76% |
16.58% |
119.18 |
|
| £15-20K |
13.86% |
13.58% |
102.02 |
|
| £20-25K |
9.17% |
10.39% |
88.22 |
|
| £25-30K |
5.98% |
7.77% |
76.96 |
|
| £30-35K |
3.92% |
5.79% |
67.66 |
|
| £35-40K |
2.60% |
4.33% |
59.91 |
|
| £40-45K |
1.74% |
3.27% |
53.40 |
|
| £45-50K |
1.19% |
2.48% |
47.90 |
|
| £50-55K |
0.82% |
1.90% |
43.22 |
|
| £55-60K |
0.58% |
1.47% |
39.22 |
|
| £60-65K |
0.41% |
1.15% |
35.76 |
|
| £65-70K |
0.30% |
0.91% |
32.77 |
|
| £70-75K |
0.22% |
0.72% |
30.16 |
|
| £75-80K |
0.16% |
0.57% |
27.88 |
|
| £80-85K |
0.12% |
0.46% |
25.86 |
|
| £85-90K |
0.09% |
0.37% |
24.07 |
|
| £90-95K |
0.07% |
0.31% |
22.48 |
|
| £95-100K |
0.05% |
0.25% |
21.06 |
|
| £100K + |
0.20% |
1.34% |
15.12 |
|
|
|

|


|
1992-1997
|
1997-2001
|
|
|
|
| Con |
-13.51% |
| Lab |
10.26% |
| LD |
-2.05% |
|
| Con |
0.74% |
| Lab |
-59.26% |
| LD |
2.57% |
|
|
 |
Ken Purchase
Conservative gain
|
| Con |
 |
9,019 |
28.63% |
| Lab |
|
0 |
0.00% |
| LD |
 |
2,494 |
7.92% |
| Oth |
 |
19,986 |
63.45% |
| Maj |
 |
6,525 |
20.71% |
| Turn |
 |
31,499 |
52.08% |
|
|
 |
Ken Purchase
Conservative gain
|
| LD |
Steven Bourne |
2,494 |
7.92% |
| UK |
Thomas McCartney |
997 |
3.17% |
| C |
Maria Miller |
9,019 |
28.63% |
| LC |
Ken Purchase |
18,989 |
60.28% |
|
Candidates representing 4 parties stood for election to this seat.
|
|
 |
Kenneth Purchase
Labour
|
| Con |
 |
11,547 |
27.89% |
| Lab |
 |
24,534 |
59.26% |
| LD |
 |
2,214 |
5.35% |
| Ref |
 |
1,192 |
2.88% |
| Oth |
 |
1,916 |
4.63% |
| Maj |
 |
12,987 |
31.37% |
| Turn |
 |
41,403 |
67.17% |
|
|
 |
|
Labour
|
| Con |
 |
20,528 |
41.40% |
| Lab |
 |
24,275 |
49.00% |
| LD |
 |
3,657 |
7.40% |
| Oth |
 |
1,087 |
2.20% |
| Maj |
 |
3,747 |
7.60% |
| Turn |
 |
49,547 |
78.17% |
|
|
 |
|

|

