|
Wolverhampton South East
Conservative gain

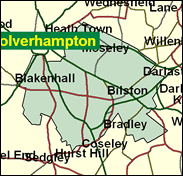
South East is a different part of the new city of Wolverhampton (elevated in December 2000) from its other two constituencies. For a start, much of it has only been included within the Metropolitan Borough of Wolverhampton since it was expanded in the 1960s. This seat used to be called Bilston. Second, it has never even come close to being won by the Conservatives, unlike Enoch Powell's SW, and NE, which defected in the Thatcherite 1980s. Third, it is clearly among the three or four most working class seats in Britain, with less than 37pc in non-manual (what used to be called white-collar) jobs. It has more ethnic minority residents than NE, but also, and elsewhere, a very high proportion of council tenants. It has had only two MPs in the last fifty years, Dennis Turner and before him Bob Edwards, who made his name in left wing politics fighting in the Spanish Civil War. Things do not move very fast or far politically in this part of the world.

Dennis Turner, Clare Short's PPS since 1997 and previously a Whip for four years (she was elected in 1987), is one of Labour's dwindling rump of proles: a burly Black Country man who as a beer-and-betting, chips-and-mushy-peas specialist is bothered about full pint measures disregarding the head, and as chairman of the Commons Catering Committee was credited with getting chips onto a Commons menu that had come (according to Joe Ashton) to resemble that of a Kensington wine bar. Born in 1942 and educated at Stonefield Secondary Modern, Bilston, and Bilston FE College, he was initially a steelworker, then transport manager, and finally chairman of a redundant steelworkers' co-operative involved in leisure provision. His Commons catering role led him to call for a "really lovely party" to celebrate the rescue of Rover in 2000.
 |
| Wealthy Achievers, Suburban Areas |
1.79% |
14.99% |
11.91 |
|
| Affluent Greys, Rural Communities |
0.00% |
2.13% |
0.00 |
|
| Prosperous Pensioners, Retirement Areas |
0.26% |
2.49% |
10.62 |
|
| Affluent Executives, Family Areas |
0.95% |
4.43% |
21.36 |
|
| Well-Off Workers, Family Areas |
4.24% |
7.27% |
58.31 |
|
| Affluent Urbanites, Town & City Areas |
0.00% |
2.56% |
0.00 |
|
| Prosperous Professionals, Metropolitan Areas |
0.00% |
2.04% |
0.00 |
|
| Better-Off Executives, Inner City Areas |
0.00% |
3.94% |
0.00 |
|
| Comfortable Middle Agers, Mature Home Owning Areas |
1.53% |
13.04% |
11.71 |
|
| Skilled Workers, Home Owning Areas |
8.93% |
12.70% |
70.26 |
|
| New Home Owners, Mature Communities |
16.76% |
8.14% |
205.82 |
|
| White Collar Workers, Better-Off Multi Ethnic Areas |
3.85% |
4.02% |
95.84 |
|
| Older People, Less Prosperous Areas |
5.84% |
3.19% |
183.30 |
|
| Council Estate Residents, Better-Off Homes |
45.92% |
11.31% |
405.96 |
|
| Council Estate Residents, High Unemployment |
3.81% |
3.06% |
124.29 |
|
| Council Estate Residents, Greatest Hardship |
5.39% |
2.52% |
214.15 |
|
| People in Multi-Ethnic, Low-Income Areas |
0.74% |
2.10% |
35.28 |
|
| Unclassified |
0.00% |
0.06% |
0.00 |
|
|
 |
 |
 |
| £0-5K |
16.44% |
9.41% |
174.62 |
|
| £5-10K |
24.49% |
16.63% |
147.25 |
|
| £10-15K |
19.91% |
16.58% |
120.09 |
|
| £15-20K |
13.43% |
13.58% |
98.85 |
|
| £20-25K |
8.61% |
10.39% |
82.88 |
|
| £25-30K |
5.50% |
7.77% |
70.80 |
|
| £30-35K |
3.56% |
5.79% |
61.50 |
|
| £35-40K |
2.35% |
4.33% |
54.21 |
|
| £40-45K |
1.58% |
3.27% |
48.38 |
|
| £45-50K |
1.08% |
2.48% |
43.64 |
|
| £50-55K |
0.76% |
1.90% |
39.72 |
|
| £55-60K |
0.54% |
1.47% |
36.43 |
|
| £60-65K |
0.39% |
1.15% |
33.64 |
|
| £65-70K |
0.28% |
0.91% |
31.24 |
|
| £70-75K |
0.21% |
0.72% |
29.17 |
|
| £75-80K |
0.16% |
0.57% |
27.35 |
|
| £80-85K |
0.12% |
0.46% |
25.74 |
|
| £85-90K |
0.09% |
0.37% |
24.32 |
|
| £90-95K |
0.07% |
0.31% |
23.05 |
|
| £95-100K |
0.05% |
0.25% |
21.90 |
|
| £100K + |
0.23% |
1.34% |
16.92 |
|
|
|

|


|
1992-1997
|
1997-2001
|
|
|
|
| Con |
-11.54% |
| Lab |
7.04% |
| LD |
-0.05% |
|
| Con |
1.62% |
| Lab |
-63.74% |
| LD |
-0.70% |
|
|
 |
Dennis Turner
Conservative gain
|
| Con |
 |
5,945 |
21.78% |
| Lab |
|
0 |
0.00% |
| LD |
 |
2,389 |
8.75% |
| Oth |
 |
18,963 |
69.47% |
| Maj |
 |
3,556 |
13.03% |
| Turn |
 |
27,297 |
50.61% |
|
|
 |
Dennis Turner
Conservative gain
|
| NF |
James Barry |
554 |
2.03% |
| C |
Adrian Pepper |
5,945 |
21.78% |
| LC |
Dennis Turner |
18,409 |
67.44% |
| LD |
Peter Wild |
2,389 |
8.75% |
|
Candidates representing 4 parties stood for election to this seat.
|
|
 |
Dennis Turner
Labour
|
| Con |
 |
7,020 |
20.16% |
| Lab |
 |
22,202 |
63.74% |
| LD |
 |
3,292 |
9.45% |
| Ref |
 |
980 |
2.81% |
| Oth |
 |
1,336 |
3.84% |
| Maj |
 |
15,182 |
43.59% |
| Turn |
 |
34,830 |
64.15% |
|
|
 |
|
Labour
|
| Con |
 |
12,975 |
31.70% |
| Lab |
 |
23,215 |
56.70% |
| LD |
 |
3,881 |
9.50% |
| Oth |
 |
850 |
2.10% |
| Maj |
 |
10,240 |
25.00% |
| Turn |
 |
40,921 |
71.70% |
|
|
 |
|

|

